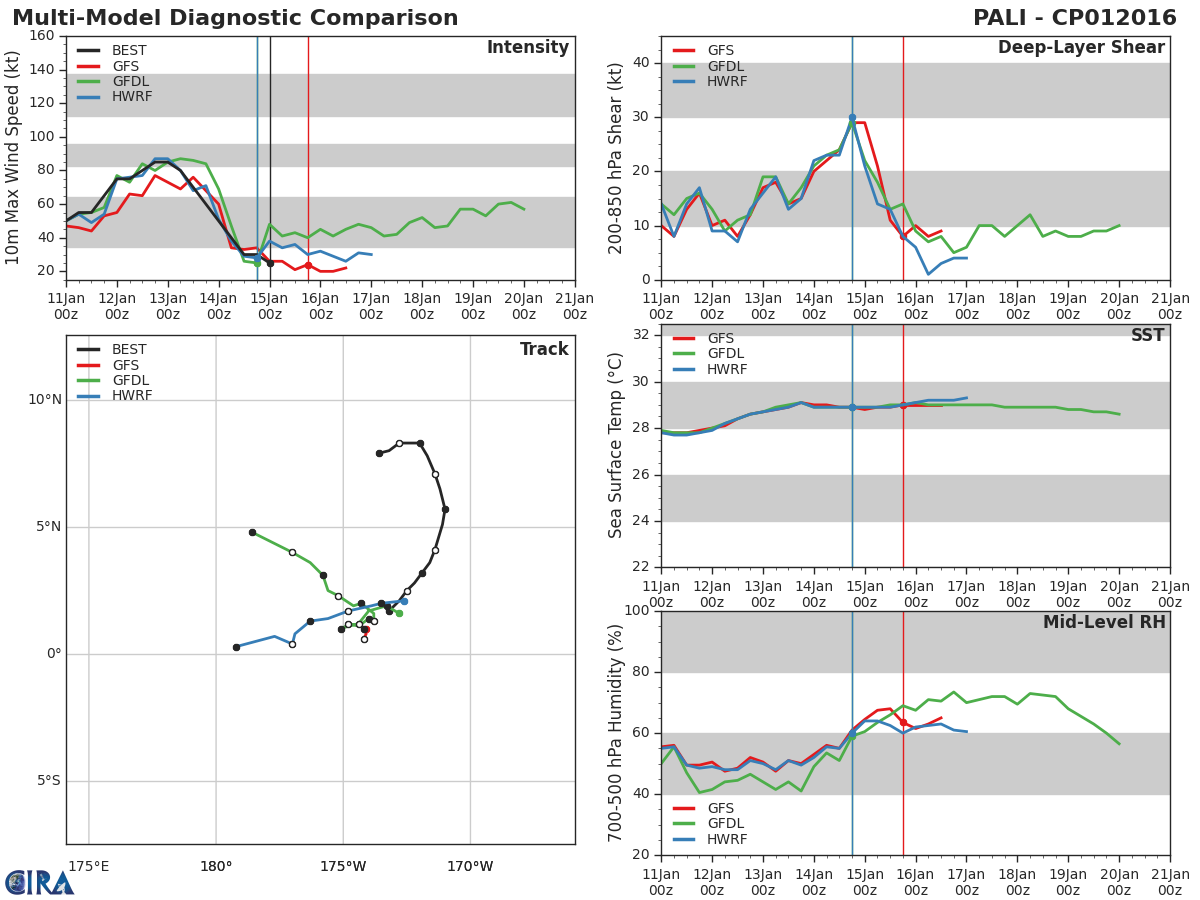
Forecast Track
Time of Latest Forecast: 2016-01-15 12:00
| Forecast Hour | Latitude | Longitude | Intensity |
| 0 | 0.0 | 0.0 | 0 |
| 12 | 0.0 | 0.0 | 0 |
| 24 | 0.0 | 0.0 | 0 |
| 36 | 0.0 | 0.0 | 0 |
| 48 | 0.0 | 0.0 | 0 |
| 72 | 0.0 | 0.0 | 0 |
| 96 | 0.0 | 0.0 | 0 |
| 120 | 0.0 | 0.0 | 0 |
Track History
| Synoptic Time | Latitude | Longitude | Intensity |
| 2016-01-15 12:00 | 1.0 | -173.7 | 20 |
| 2016-01-15 06:00 | 1.2 | -173.3 | 20 |
| 2016-01-15 00:00 | 1.7 | -173.2 | 25 |
| 2016-01-14 18:00 | 2.1 | -172.8 | 30 |
| 2016-01-14 12:00 | 2.6 | -172.7 | 30 |
| 2016-01-14 06:00 | 2.4 | -172.2 | 40 |
| 2016-01-14 00:00 | 2.9 | -171.9 | 55 |
| 2016-01-13 18:00 | 3.6 | -171.6 | 70 |
| 2016-01-13 12:00 | 4.4 | -171.6 | 70 |
| 2016-01-13 06:00 | 5.1 | -171.1 | 80 |
| 2016-01-13 00:00 | 5.7 | -171.0 | 85 |
| 2016-01-12 18:00 | 6.5 | -171.2 | 85 |
| 2016-01-12 12:00 | 7.1 | -171.5 | 80 |
| 2016-01-12 06:00 | 7.8 | -171.7 | 75 |
| 2016-01-12 00:00 | 8.3 | -172.0 | 75 |
| 2016-01-11 18:00 | 8.3 | -172.6 | 55 |
| 2016-01-11 12:00 | 8.2 | -173.1 | 50 |
| 2016-01-11 06:00 | 7.9 | -173.5 | 55 |
| 2016-01-11 00:00 | 7.4 | -174.0 | 50 |
| 2016-01-10 18:00 | 7.8 | -174.0 | 45 |
| 2016-01-10 12:00 | 7.6 | -174.3 | 35 |
| 2016-01-10 06:00 | 7.7 | -174.5 | 35 |
| 2016-01-10 00:00 | 7.7 | -174.4 | 35 |
| 2016-01-09 18:00 | 7.7 | -174.1 | 40 |
| 2016-01-09 12:00 | 8.0 | -173.7 | 45 |
| 2016-01-09 06:00 | 7.8 | -173.2 | 50 |
| 2016-01-09 00:00 | 7.5 | -172.8 | 55 |
| 2016-01-08 18:00 | 7.0 | -172.7 | 55 |
| 2016-01-08 12:00 | 6.9 | -171.8 | 55 |
| 2016-01-08 06:00 | 5.6 | -171.6 | 45 |
| 2016-01-08 00:00 | 4.9 | -171.2 | 45 |
| 2016-01-07 18:00 | 4.4 | -171.1 | 45 |
| 2016-01-07 12:00 | 3.7 | -171.3 | 30 |
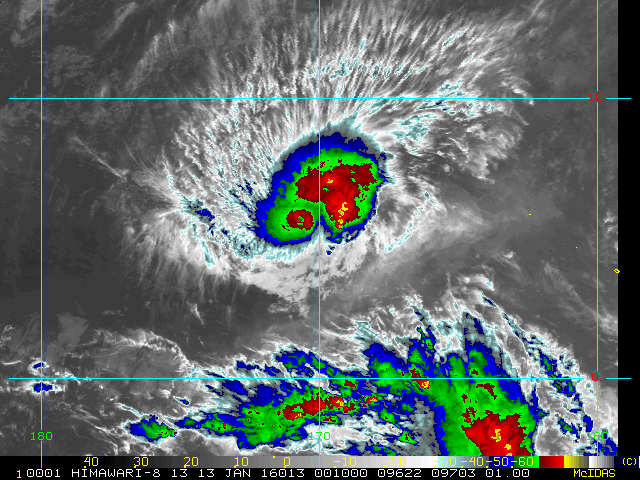
Enhanced Infrared (IR) Imagery (4 km Mercator)

Loop | Latest Image | Archive | About
Time of This Image: 2016-01-13 00:10
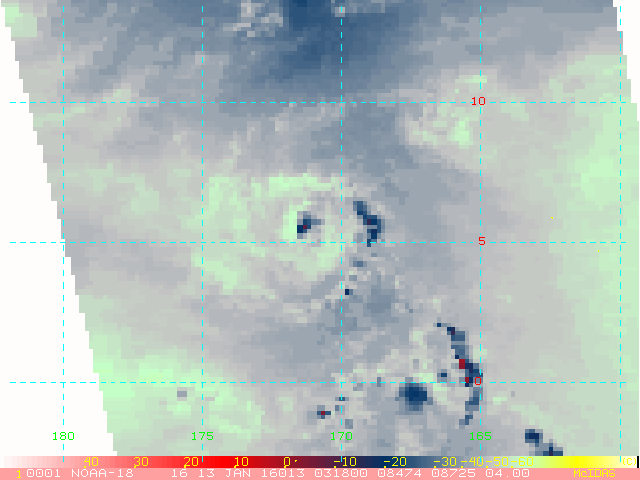
AMSU Microwave 89 GHz Imagery (4 km Mercator)

Loop | Latest Image | Archive | About
Time of This Image: 2016-01-13 03:18
Multiplatform Satellite Surface Wind Analysis (Experimental)

Latest Image | Archive | About
Time of This Image: 2016-01-15 18:00
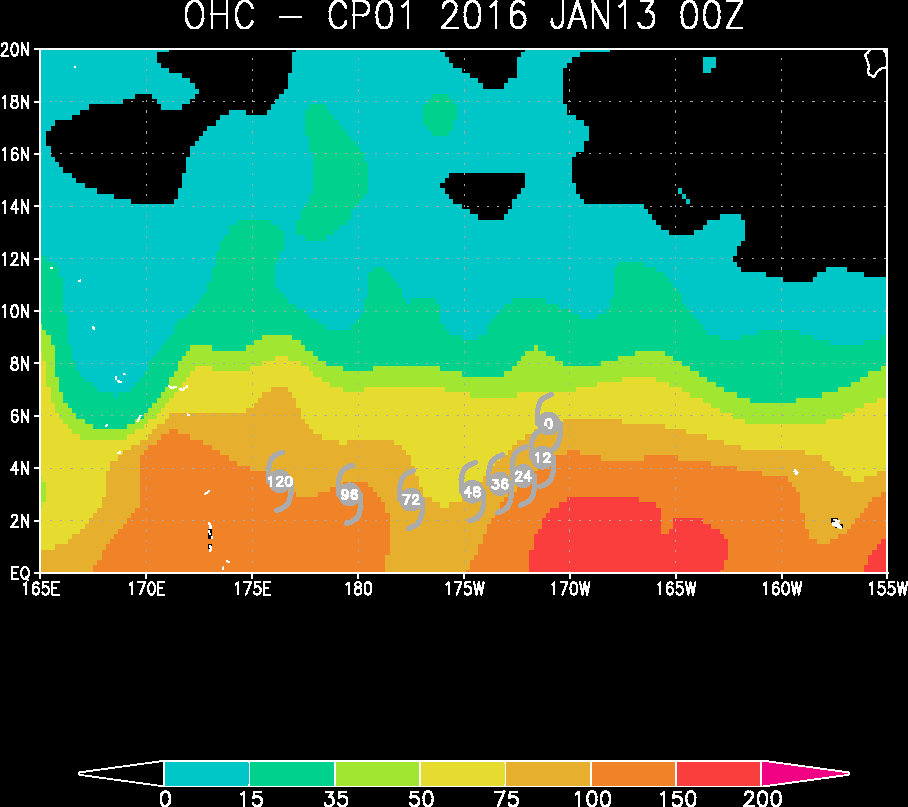
Ocean Heat Content & Forecast Track
Latest Image | Archive | About
Time of This Image: 2016-01-13 00:00
