Forecast Track
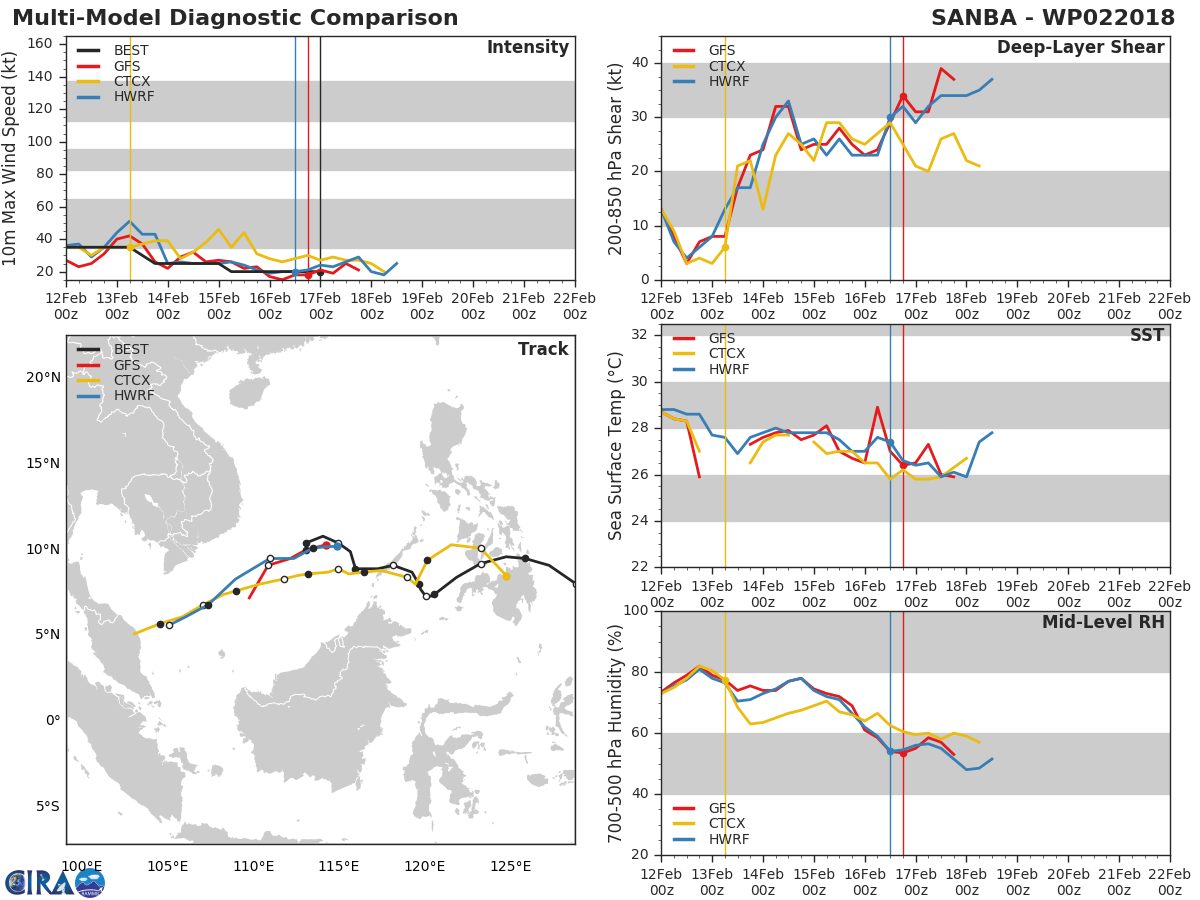
Time of Latest Forecast: 2018-02-16 12:00
| Forecast Hour | Latitude | Longitude | Intensity |
| 0 | 0.0 | 0.0 | 0 |
| 12 | 0.0 | 0.0 | 0 |
| 24 | 0.0 | 0.0 | 0 |
| 36 | 0.0 | 0.0 | 0 |
| 48 | 0.0 | 0.0 | 0 |
| 72 | 0.0 | 0.0 | 0 |
| 96 | 0.0 | 0.0 | 0 |
| 120 | 0.0 | 0.0 | 0 |
Track History
| Synoptic Time | Latitude | Longitude | Intensity |
| 2018-02-16 12:00 | 10.4 | 115.0 | 20 |
| 2018-02-16 06:00 | 9.9 | 115.7 | 20 |
| 2018-02-16 00:00 | 8.9 | 116.0 | 20 |
| 2018-02-15 18:00 | 8.6 | 117.3 | 20 |
| 2018-02-15 12:00 | 9.1 | 118.2 | 20 |
| 2018-02-15 06:00 | 8.7 | 119.3 | 20 |
| 2018-02-15 00:00 | 7.6 | 119.6 | 25 |
| 2018-02-14 18:00 | 7.3 | 119.5 | 25 |
| 2018-02-14 12:00 | 6.8 | 119.2 | 25 |
| 2018-02-14 06:00 | 6.7 | 119.4 | 25 |
| 2018-02-14 00:00 | 7.4 | 119.9 | 25 |
| 2018-02-13 18:00 | 8.4 | 121.9 | 25 |
| 2018-02-13 12:00 | 9.2 | 123.3 | 30 |
| 2018-02-13 06:00 | 9.6 | 124.8 | 35 |
| 2018-02-13 00:00 | 9.8 | 125.8 | 35 |
| 2018-02-12 18:00 | 9.3 | 127.3 | 35 |
| 2018-02-12 12:00 | 7.4 | 129.1 | 35 |
| 2018-02-12 06:00 | 6.9 | 130.6 | 35 |
| 2018-02-12 00:00 | 7.1 | 132.1 | 35 |
| 2018-02-11 18:00 | 7.4 | 133.2 | 35 |
| 2018-02-11 12:00 | 7.0 | 134.3 | 35 |
| 2018-02-11 06:00 | 6.9 | 135.9 | 35 |
| 2018-02-11 00:00 | 6.6 | 137.5 | 35 |
| 2018-02-10 18:00 | 6.6 | 137.2 | 45 |
| 2018-02-10 12:00 | 6.7 | 139.7 | 30 |
| 2018-02-10 06:00 | 7.8 | 141.8 | 25 |
| 2018-02-10 00:00 | 9.7 | 142.9 | 25 |
| 2018-02-09 18:00 | 10.0 | 143.6 | 25 |
| 2018-02-09 12:00 | 10.1 | 144.9 | 30 |
| 2018-02-09 06:00 | 10.5 | 146.0 | 30 |
| 2018-02-09 00:00 | 11.0 | 147.3 | 20 |
| 2018-02-08 18:00 | 10.8 | 147.8 | 20 |
Enhanced Infrared (IR) Imagery (4 km Mercator)

Loop | Latest Image | Archive | About
Time of This Image: 2018-02-10 18:00
AMSU Microwave 89 GHz Imagery (4 km Mercator)

Loop | Latest Image | Archive | About
Time of This Image: 2018-02-10 18:13
Multiplatform Satellite Surface Wind Analysis (Experimental)

Latest Image | Archive | About
Time of This Image: 2018-02-16 21:00
Ocean Heat Content & Forecast Track
Latest Image | Archive | About
Time of This Image: 2018-02-10 18:00
