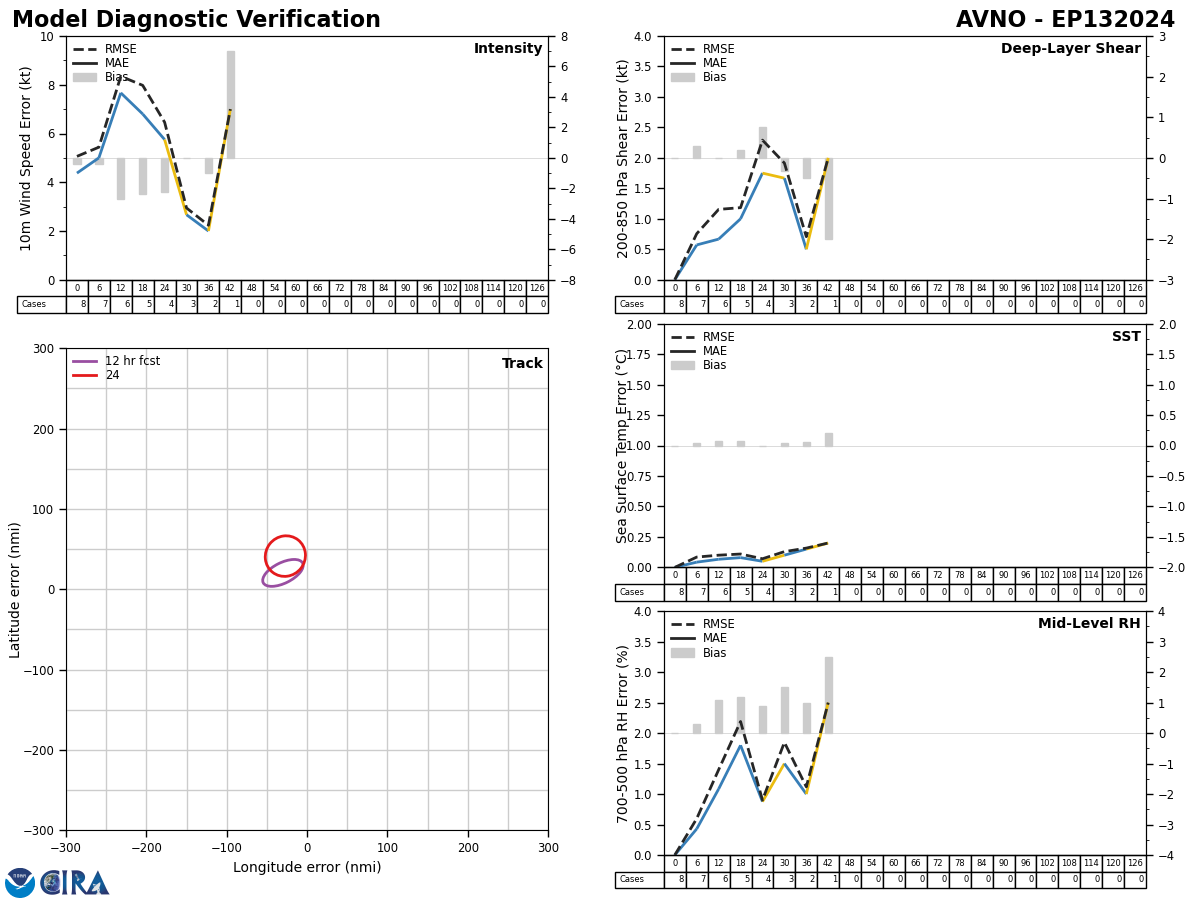
Diagnostics

GEFS Model Diagnostic Plot

Loop | Latest Image | Archive | About
Time of This Image: 2024-11-03 12:00

Multi-model Track & Intensity Forecast Verification

Loop | Latest Image | Archive | About
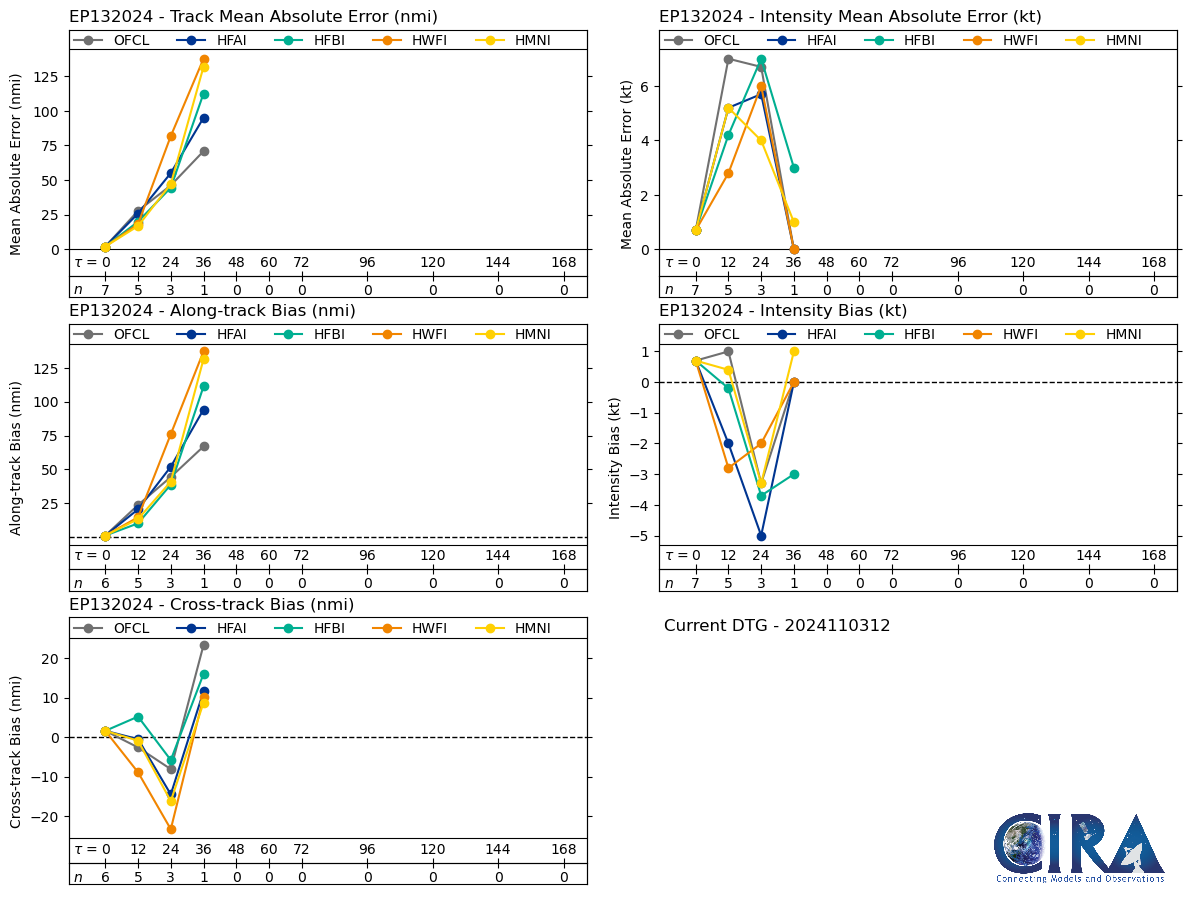
Time of This Image: 2024-11-03 12:00
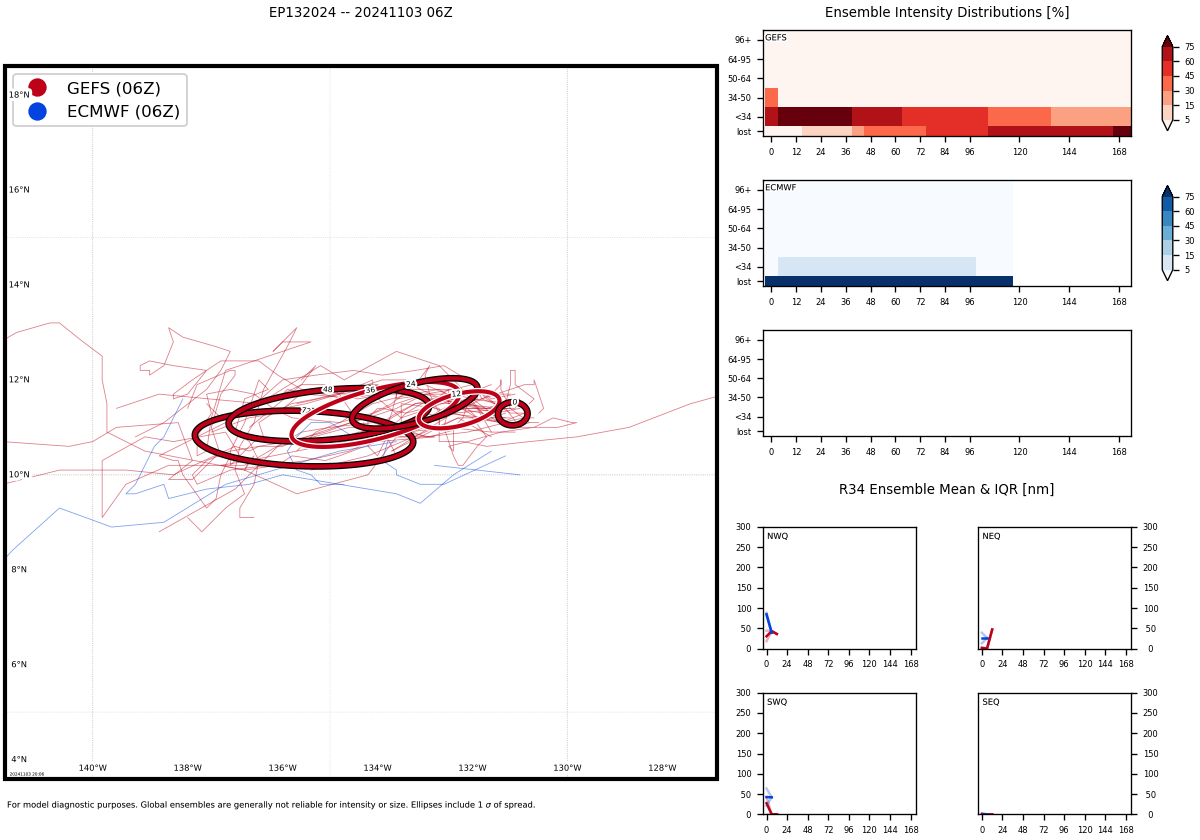
Machine-Learning Forecast Uncertainty Estimates
Global Models
GFS Model Data
GFS Precipitation & Sea Surface Temperature

Loop | Latest Image | Archive | About
Time of This Image: 2024-11-03 06:00
GFS 850 hPa Vorticity & Vertical Motion

Loop | Latest Image | Archive | About
Time of This Image: 2024-11-03 06:00
GFS 10m Wind Speed & Sea Level Pressure
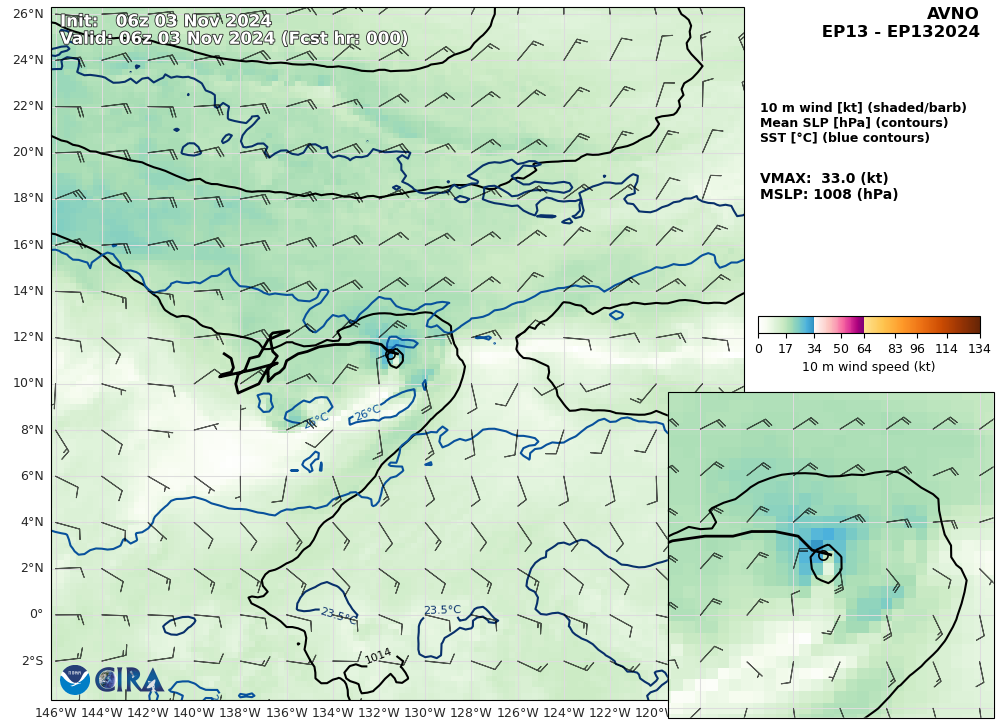
Loop | Latest Image | Archive | About
Time of This Image: 2024-11-03 06:00
GFS Simulated Infrared Brightness Temperature

Loop | Latest Image | Archive | About
Time of This Image: 2024-11-03 06:00
GFS Diagnostic Verification - Intensity, 850-200 mb Shear, Sea Surface Temperature, and 700-500 mb Relative Humidity
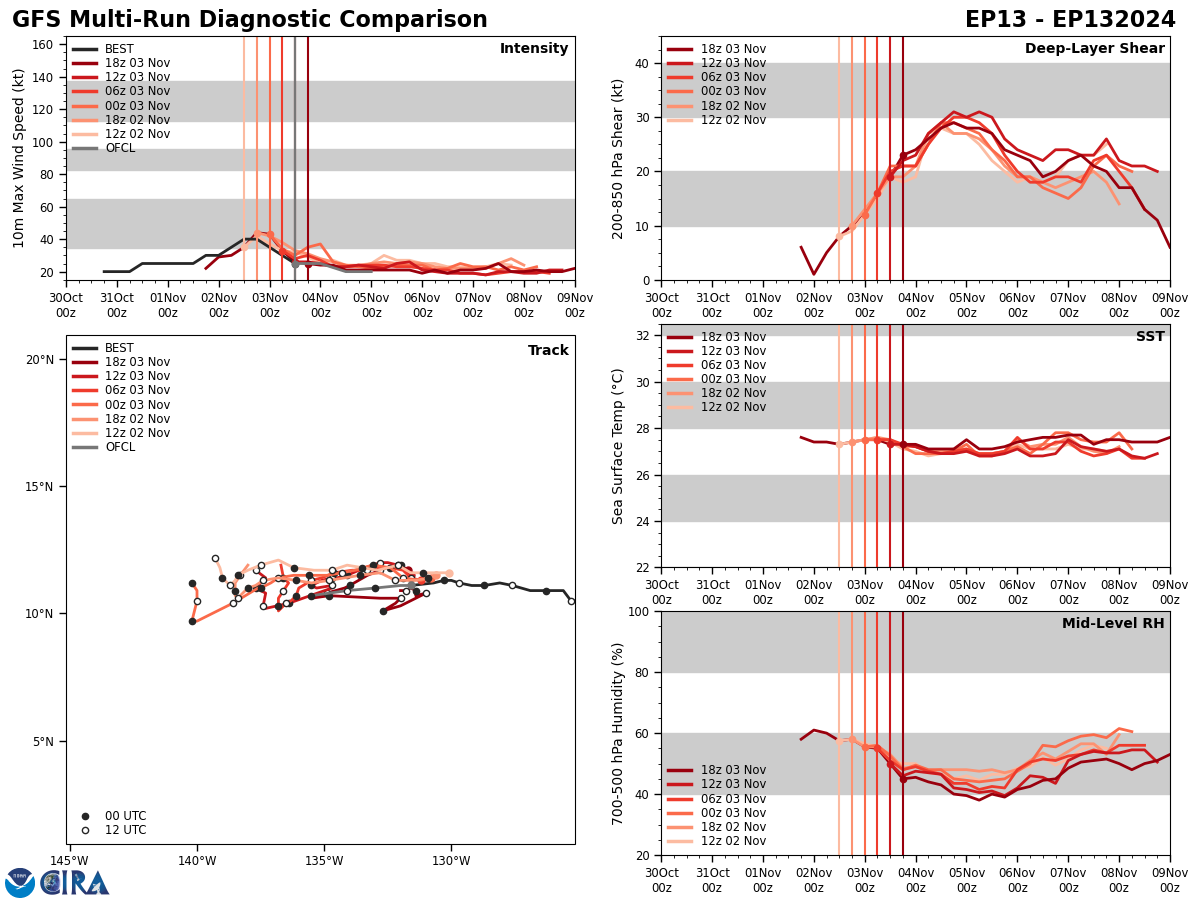
GFS Model Diagnostic Plot - Multiple Runs

Loop | Latest Image | Archive | About
Time of This Image: 2024-11-04 00:00
ECMWF Model Data
Hurricane Models
HFSA Model Data
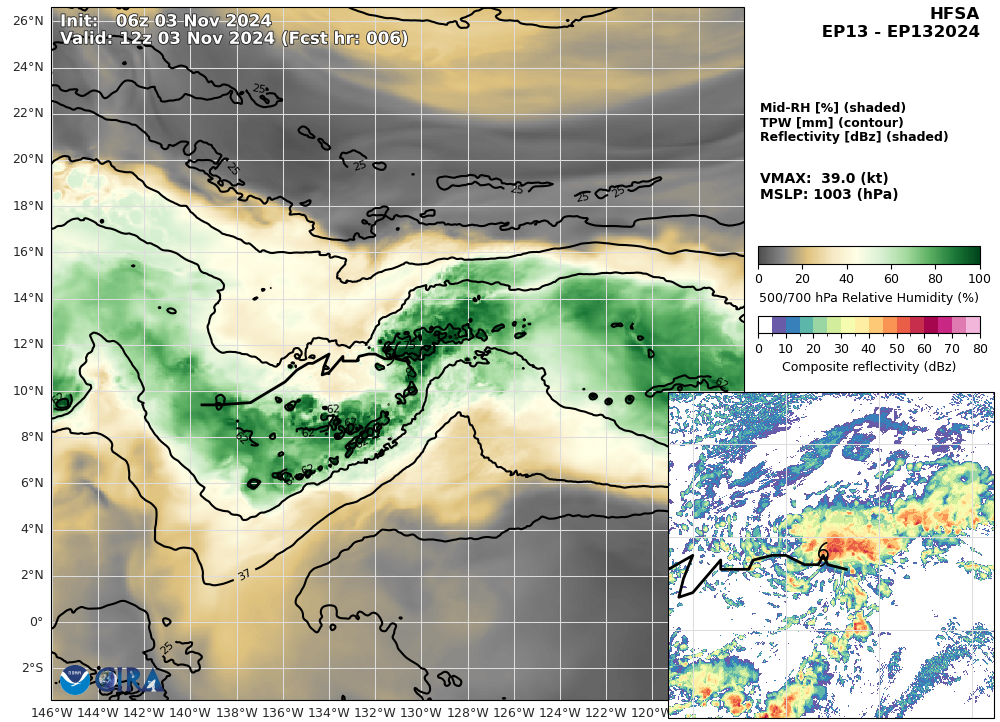
HFSA Precipitation & Sea Surface Temperature
Loop | Latest Image | Archive | About
Time of This Image: 2024-11-03 06:00
HFSA 850 hPa Vorticity & Vertical Motion

Loop | Latest Image | Archive | About
Time of This Image: 2024-11-03 06:00
HFSA 10m Wind Speed & Sea Level Pressure

Loop | Latest Image | Archive | About
Time of This Image: 2024-11-03 06:00
HFSA Simulated Infrared Brightness Temperature

Loop | Latest Image | Archive | About
Time of This Image: 2024-11-03 06:00
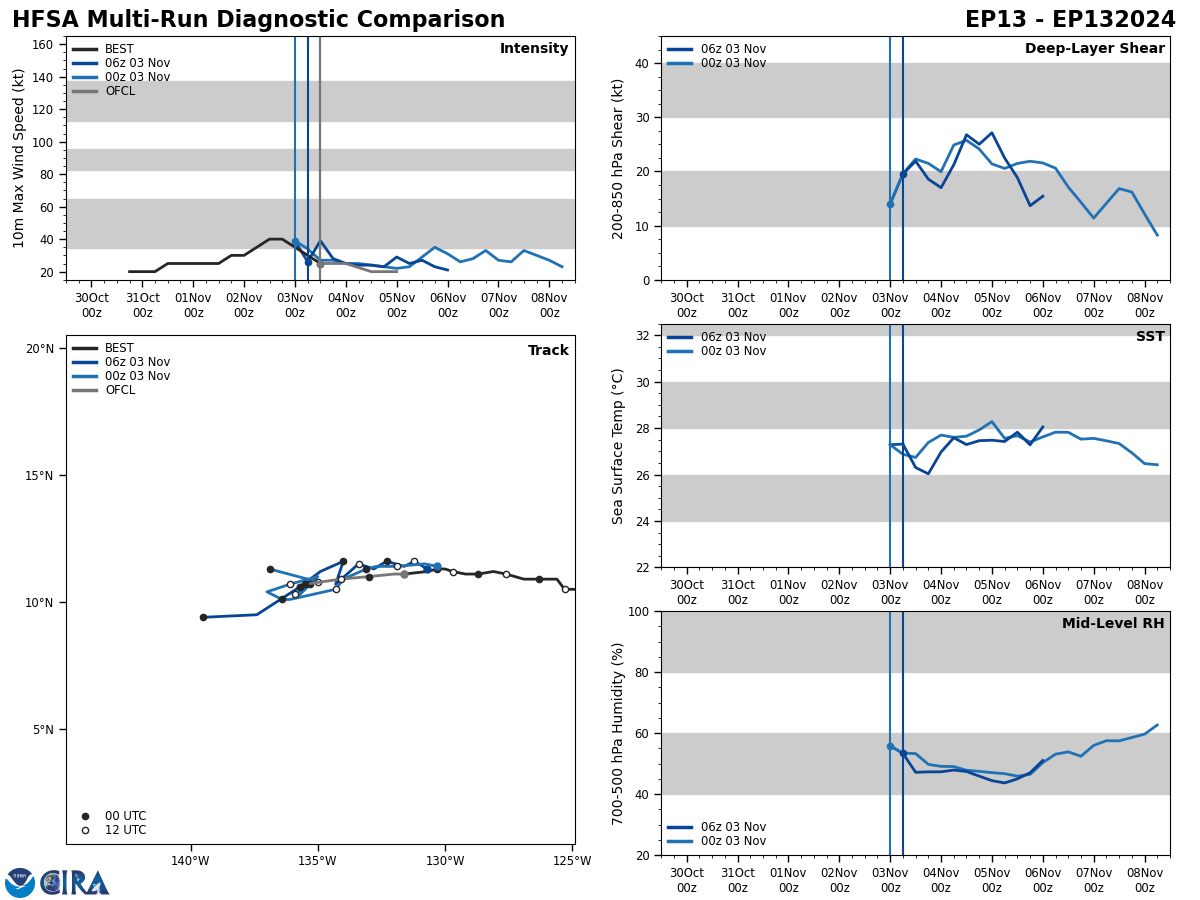
HFSA Model Diagnostic Plot - Multiple Runs

Loop | Latest Image | Archive | About
Time of This Image: 2024-11-03 12:00
HFSA Simulated Microwave Brightness Temperature
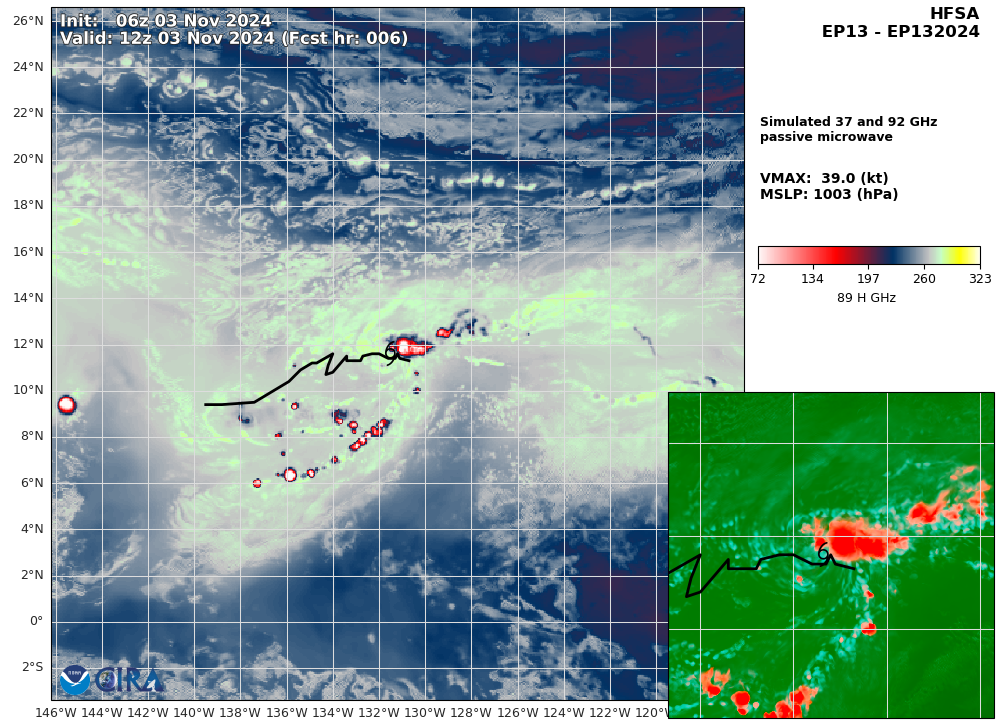
Loop | Latest Image | Archive | About
Time of This Image: 2024-11-03 06:00
HFSB Model Data
HFSB Precipitation & Sea Surface Temperature
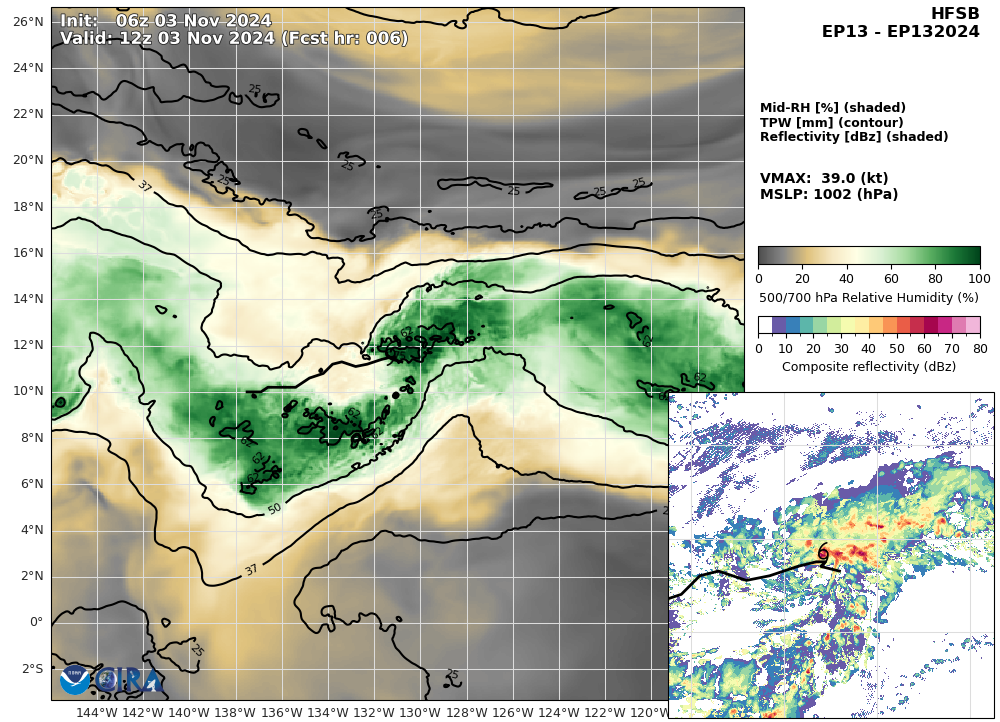
Loop | Latest Image | Archive | About
Time of This Image: 2024-11-03 06:00
HFSB 850 hPa Vorticity & Vertical Motion
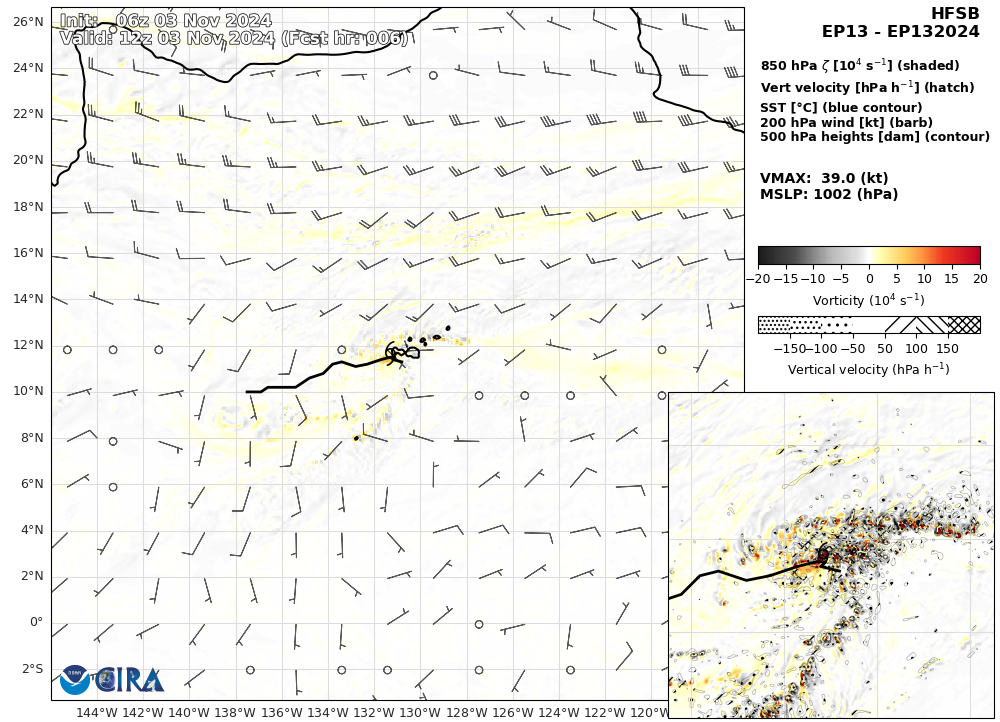
Loop | Latest Image | Archive | About
Time of This Image: 2024-11-03 06:00
HFSB 10m Wind Speed & Sea Level Pressure

Loop | Latest Image | Archive | About
Time of This Image: 2024-11-03 06:00
HFSB Simulated Infrared Brightness Temperature

Loop | Latest Image | Archive | About
Time of This Image: 2024-11-03 06:00
HFSB Model Diagnostic Plot - Multiple Runs

Loop | Latest Image | Archive | About
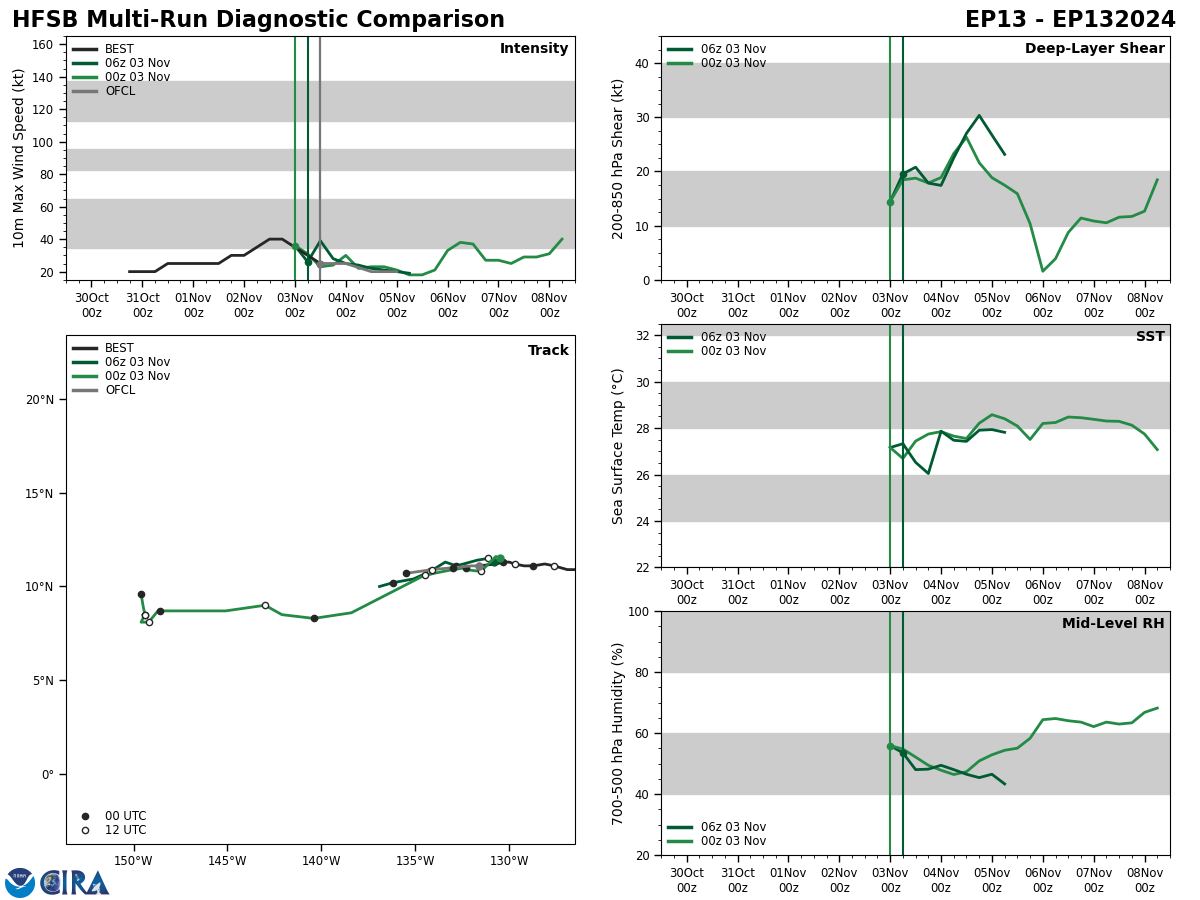
Time of This Image: 2024-11-03 12:00
HFSB Simulated Microwave Brightness Temperature

Loop | Latest Image | Archive | About
Time of This Image: 2024-11-03 06:00
HWRF Model Data
HWRF Precipitation & Sea Surface Temperature
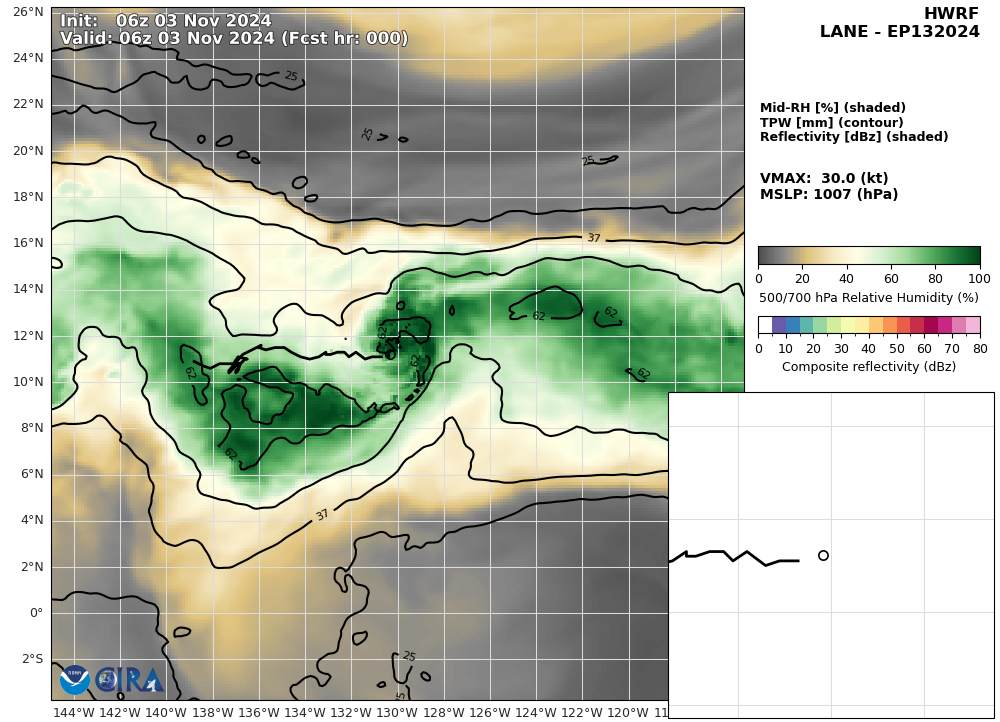
Loop | Latest Image | Archive | About
Time of This Image: 2024-11-03 06:00
HWRF 850 hPa Vorticity & Vertical Motion

Loop | Latest Image | Archive | About
Time of This Image: 2024-11-03 06:00
HWRF 10m Wind Speed & Sea Level Pressure

Loop | Latest Image | Archive | About
Time of This Image: 2024-11-03 06:00
HWRF Diagnostic Verification - Intensity, 850-200 mb Shear, Sea Surface Temperature, and 700-500 mb Relative Humidity

HWRF Model Diagnostic Plot - Multiple Runs

Loop | Latest Image | Archive | About
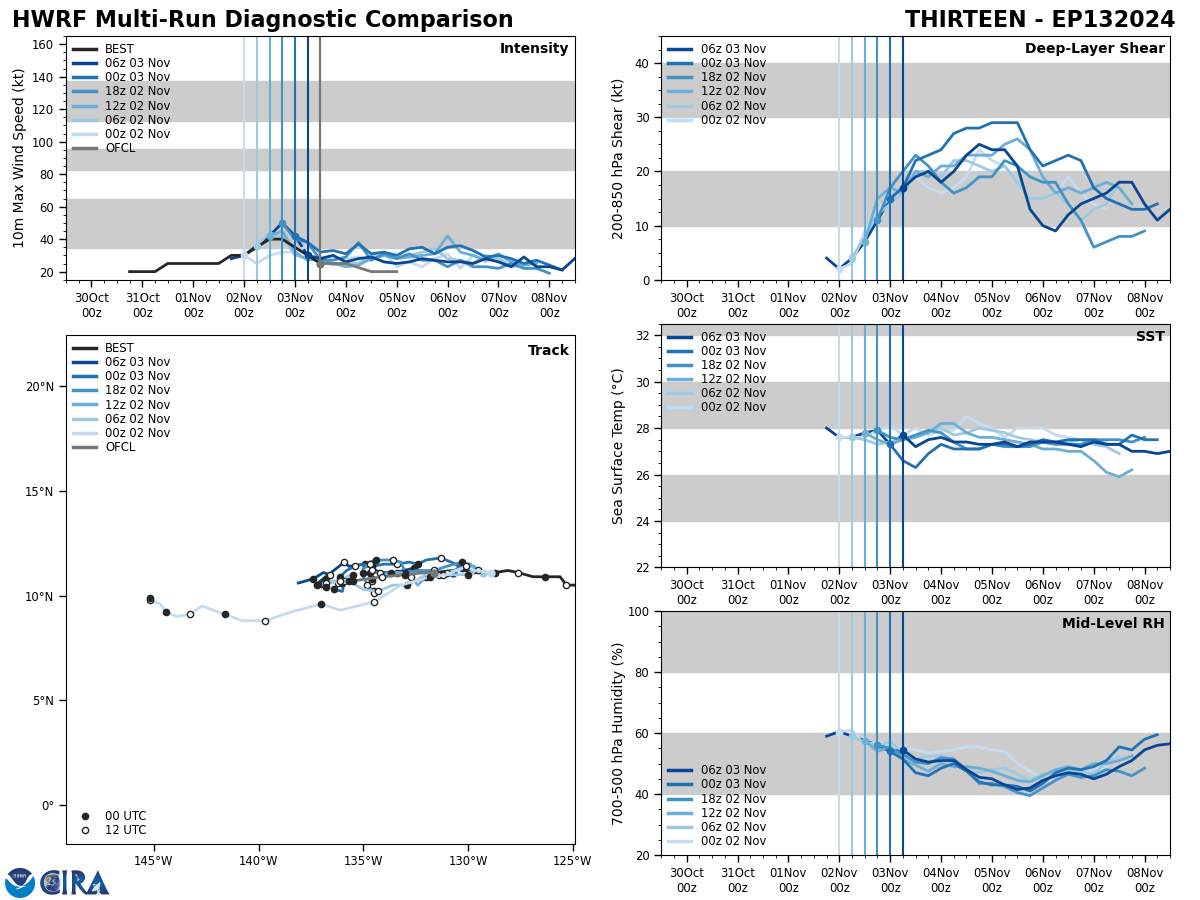
Time of This Image: 2024-11-03 12:00
HMON Model Data
HMON Precipitation & Sea Surface Temperature
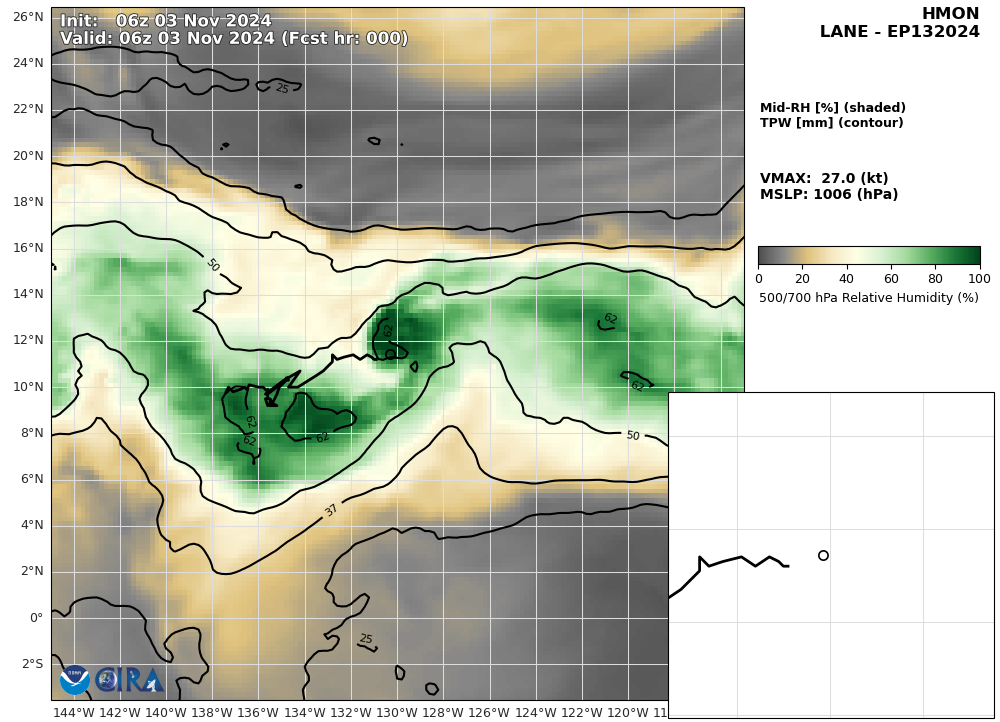
Loop | Latest Image | Archive | About
Time of This Image: 2024-11-03 06:00
HMON 850 hPa Vorticity & Vertical Motion

Loop | Latest Image | Archive | About
Time of This Image: 2024-11-03 06:00
HMON 10m Wind Speed & Sea Level Pressure

Loop | Latest Image | Archive | About
Time of This Image: 2024-11-03 06:00
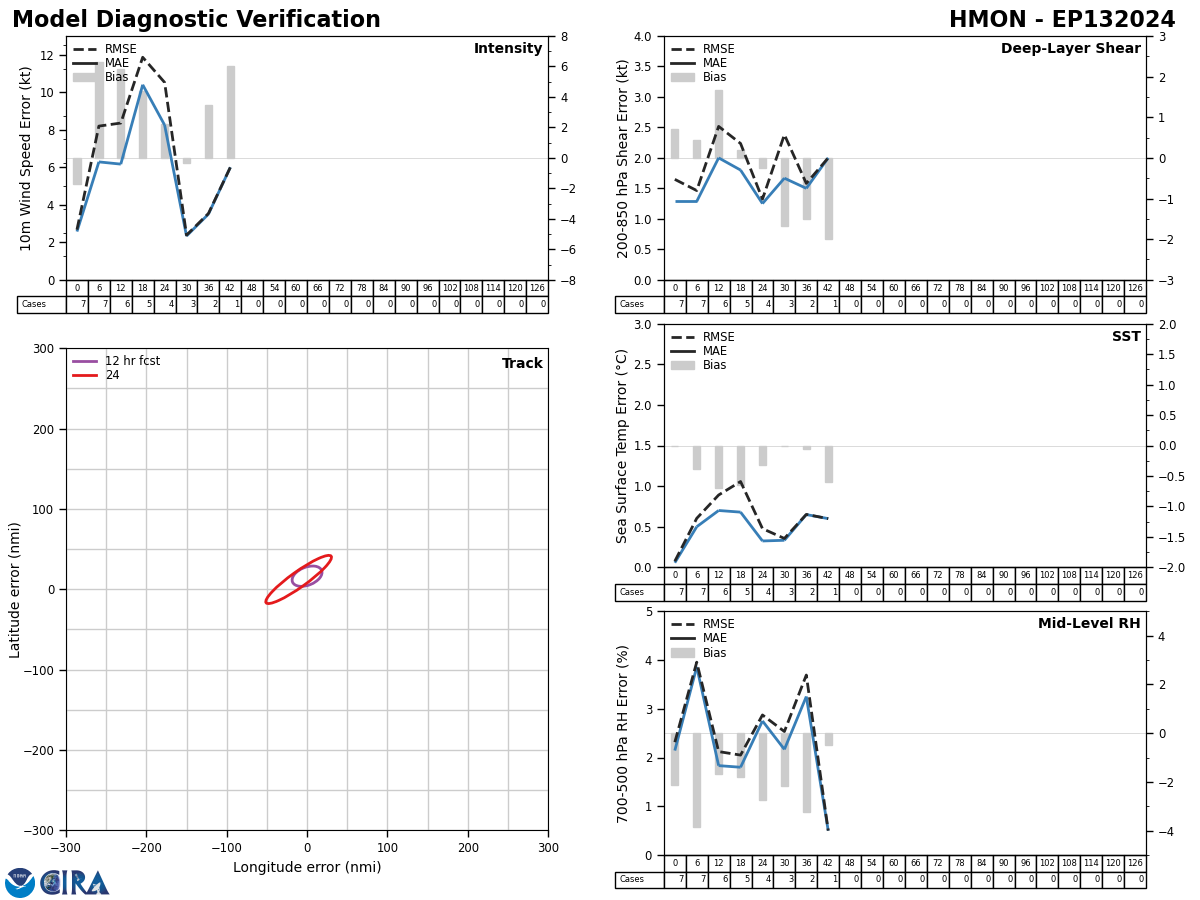
HMON Diagnostic Verification - Intensity, 850-200 mb Shear, Sea Surface Temperature, and 700-500 mb Relative Humidity
HMON Model Diagnostic Plot - Multiple Runs

Loop | Latest Image | Archive | About
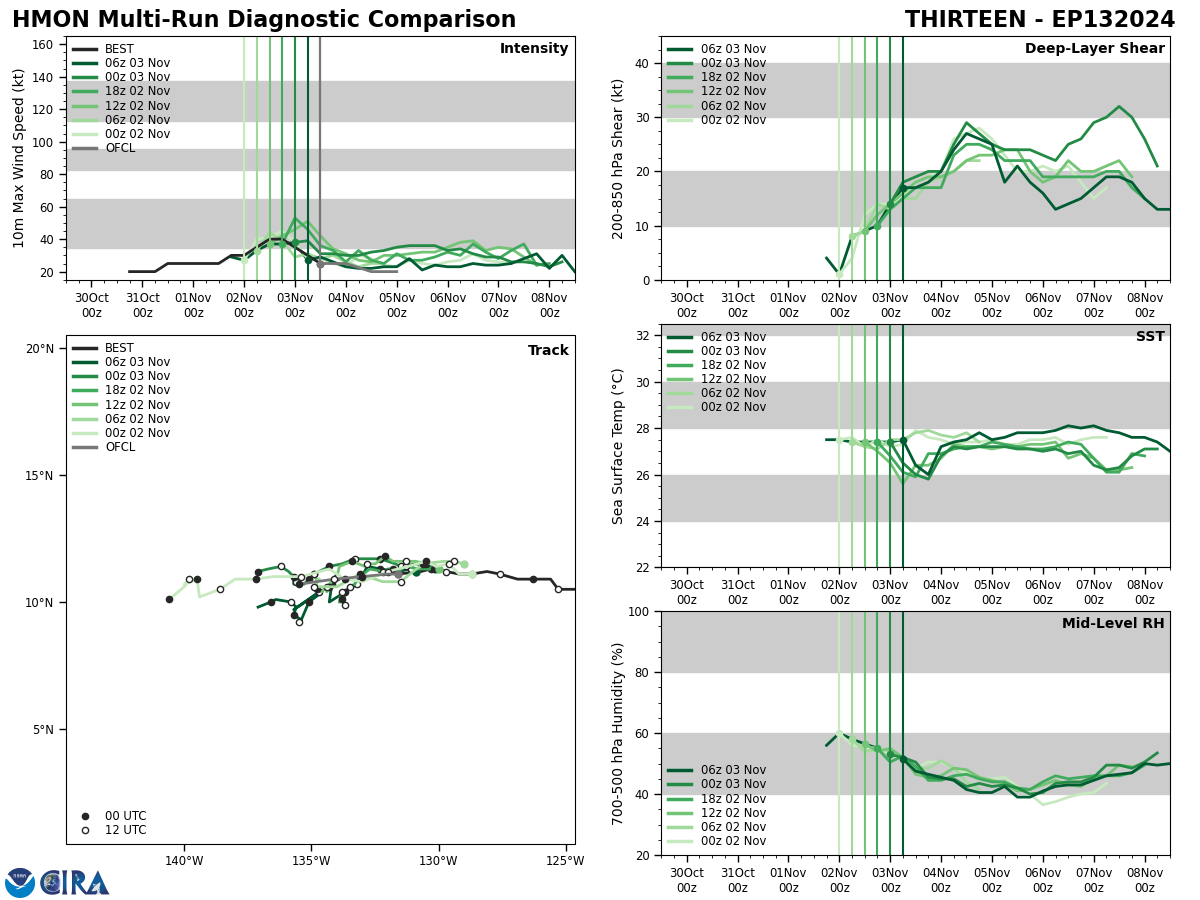
Time of This Image: 2024-11-03 12:00
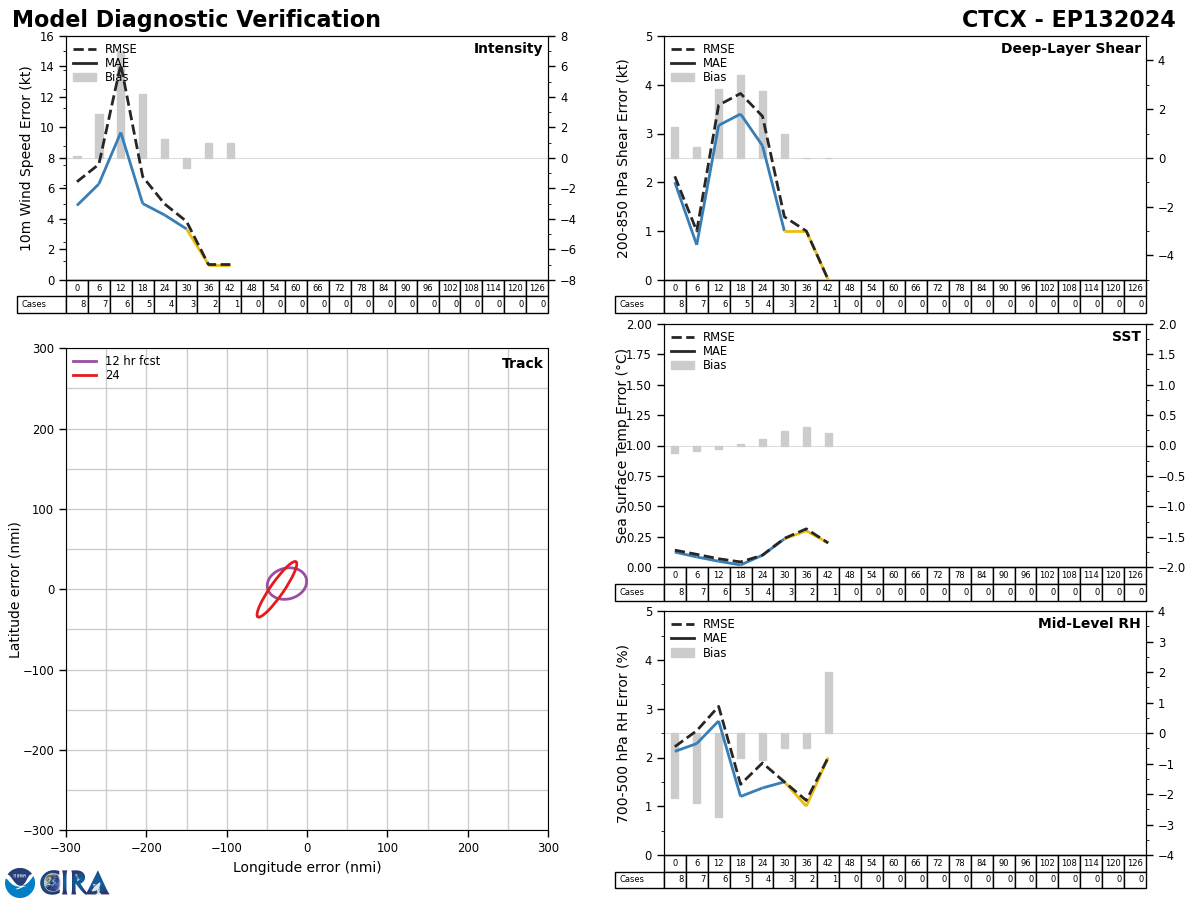
CTCX
CTCX Model Diagnostic Plot - Multiple Runs

Loop | Latest Image | Archive | About
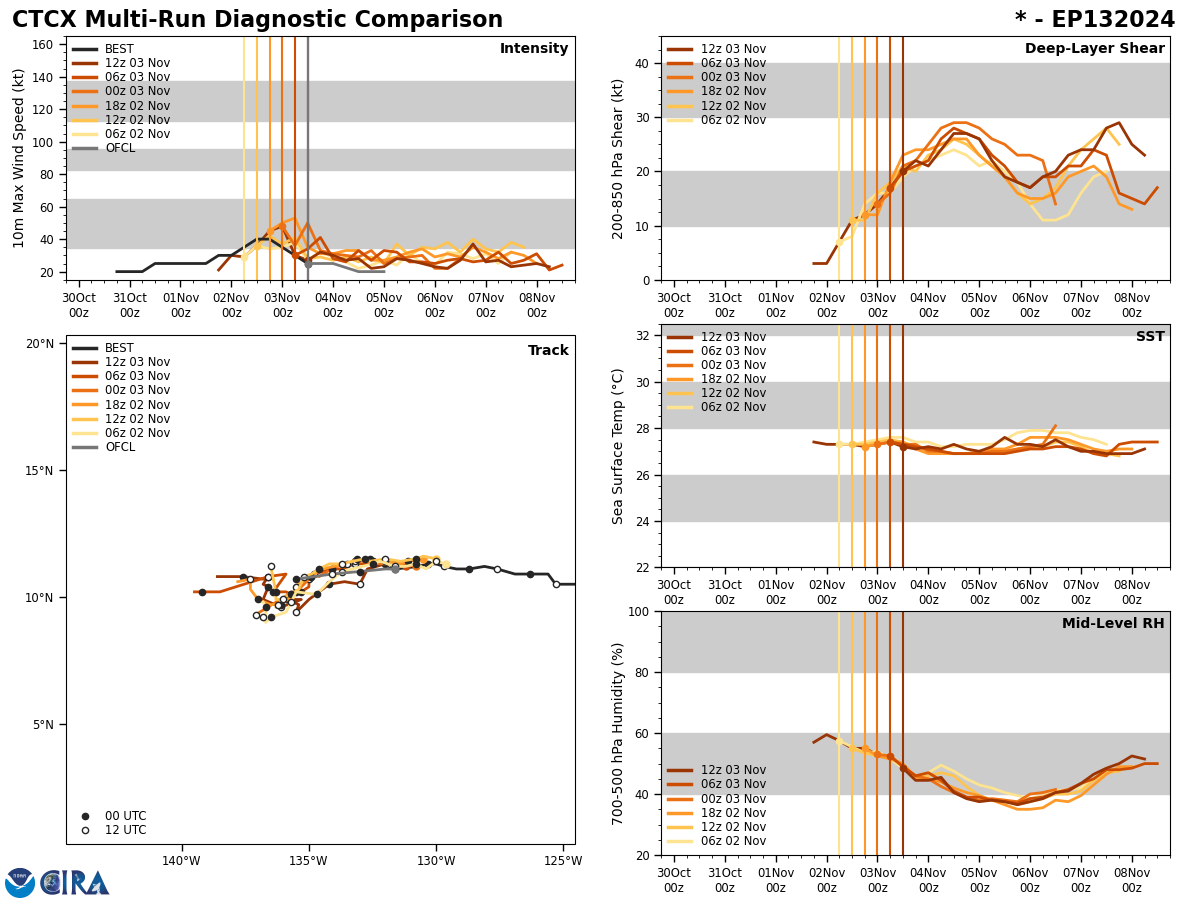
Time of This Image: 2024-11-03 18:00
CTCX Diagnostic Verification - Intensity, 850-200 mb Shear, Sea Surface Temperature, and 700-500 mb Relative Humidity