Diagnostics

GEFS Model Diagnostic Plot

Loop | Latest Image | Archive | About
Time of This Image: 2025-10-11 06:00

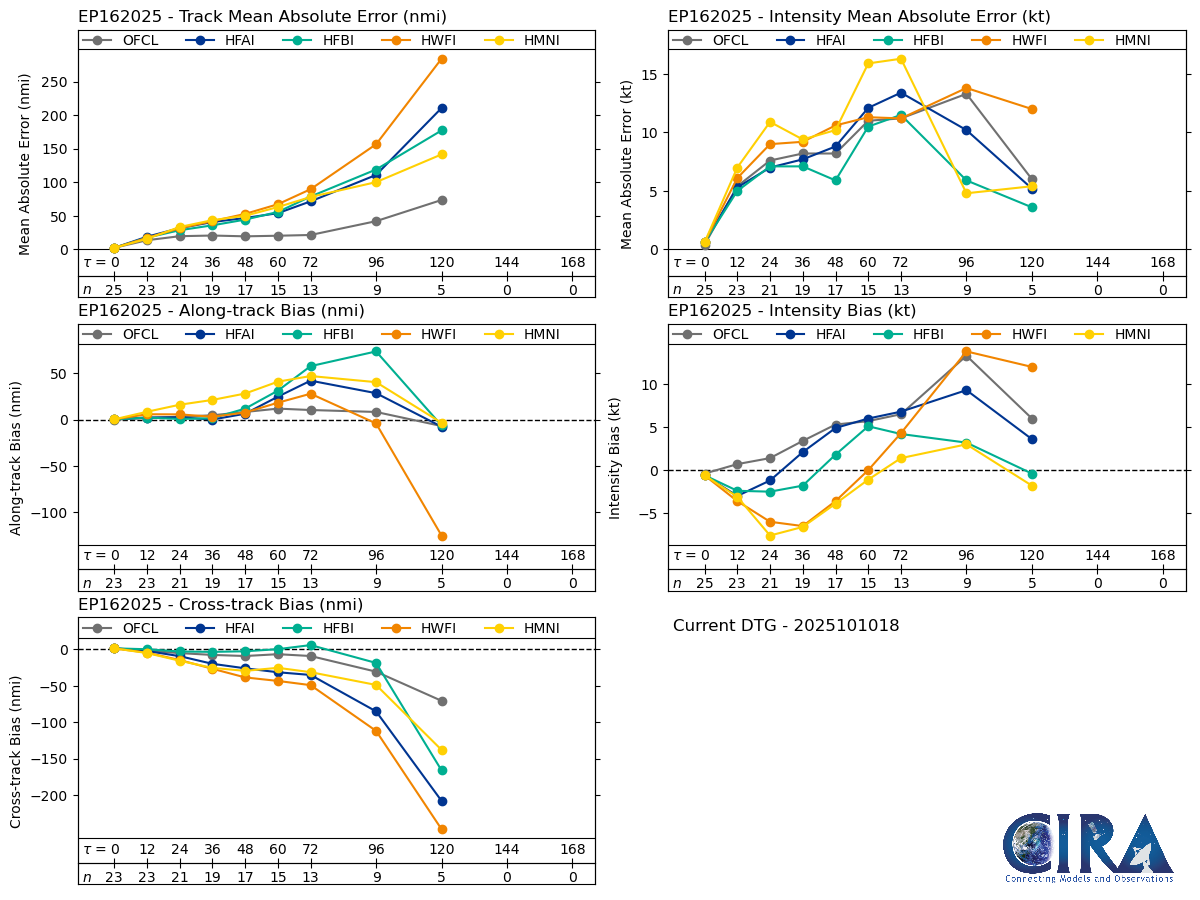
Multi-model Track & Intensity Forecast Verification

Loop | Latest Image | Archive | About
Time of This Image: 2025-10-10 18:00

AI Weather Model Forecast Verification

Loop | Latest Image | Archive | About
Time of This Image: 2025-10-10 18:00
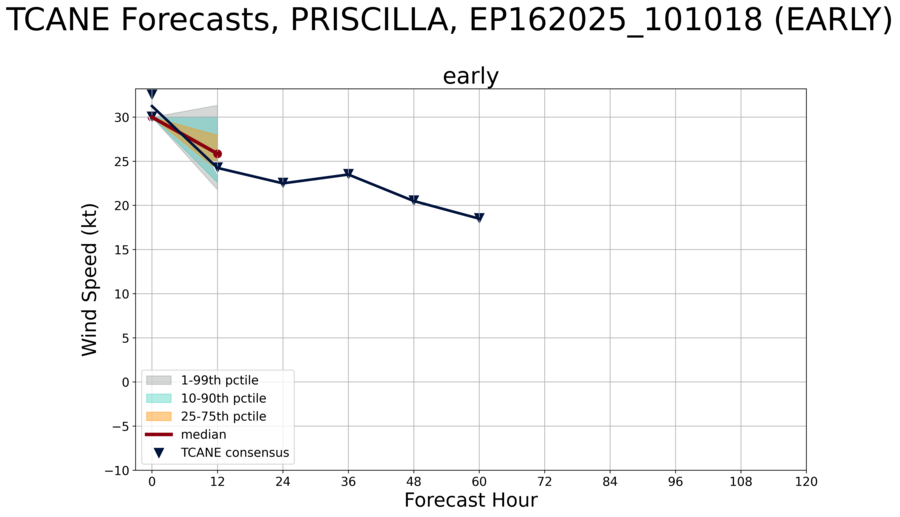
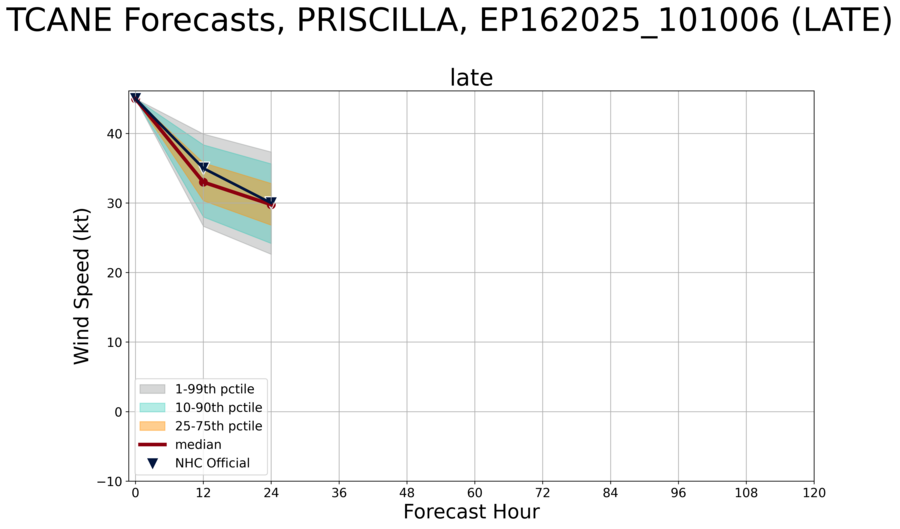
Machine-Learning Forecast Uncertainty Estimates
Consensus model track error distribution
Loop | Latest Image | Archive | About
Time of This Image: 2025-10-10 18:00
NHC official forecast track error distribution
Loop | Latest Image | Archive | About
Time of This Image: 2025-10-10 06:00
Consensus model intensity error distribution
Loop | Latest Image | Archive | About
Time of This Image: 2025-10-10 18:00
NHC official forecast intensity error distributions
Loop | Latest Image | Archive | About
Time of This Image: 2025-10-10 06:00
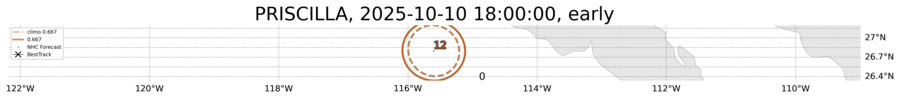
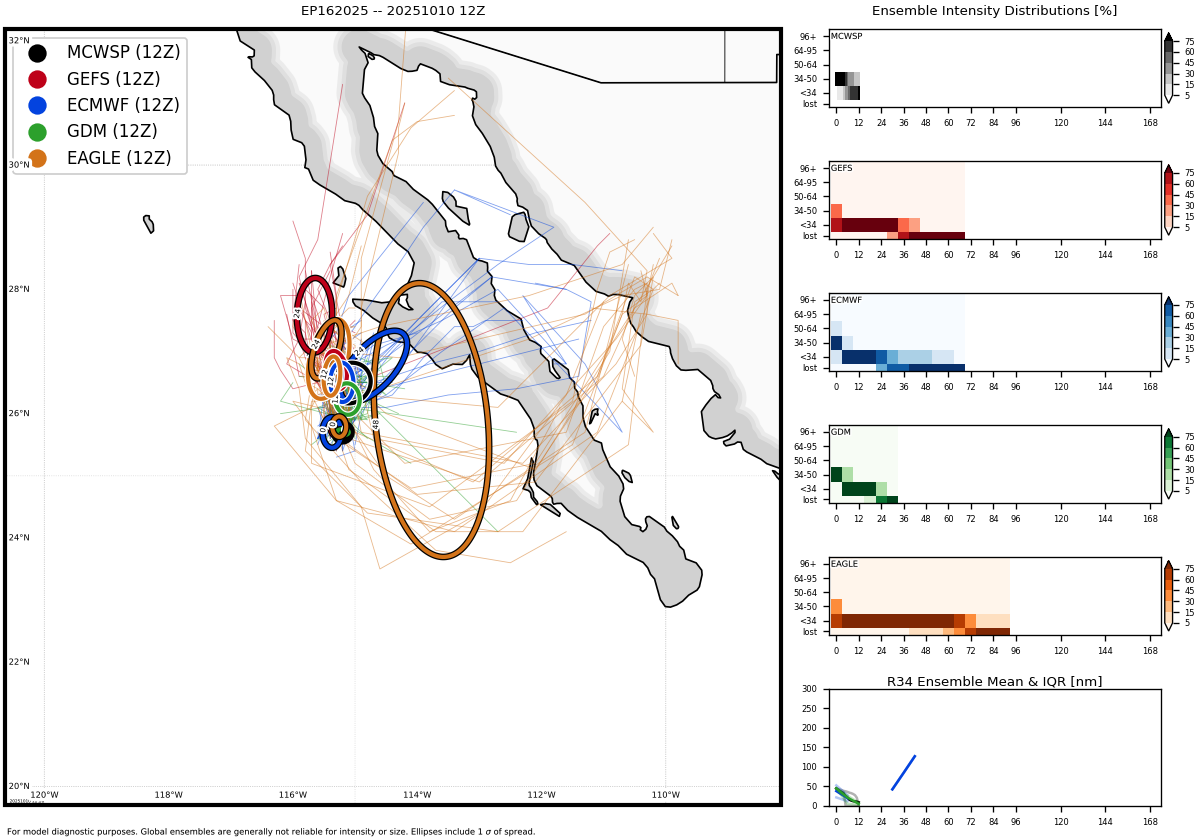
Consensus model probability of a category 1-5 hurricane
Loop | Latest Image | Archive | About
Time of This Image: 2025-10-10 18:00
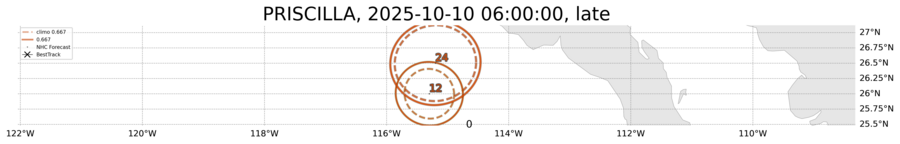
Probability of a category 1-5 hurricane from NHC forecast error distribution
Loop | Latest Image | Archive | About
Time of This Image: 2025-10-10 06:00
Probability of rapid intensification from consensus model error distribution
Loop | Latest Image | Archive | About
Time of This Image: 2025-10-10 18:00
Probability of rapid intensification from NHC forecast error distribution
Loop | Latest Image | Archive | About
Time of This Image: 2025-10-10 06:00
Global Models
GFS Model Data
GFS Precipitation & Sea Surface Temperature
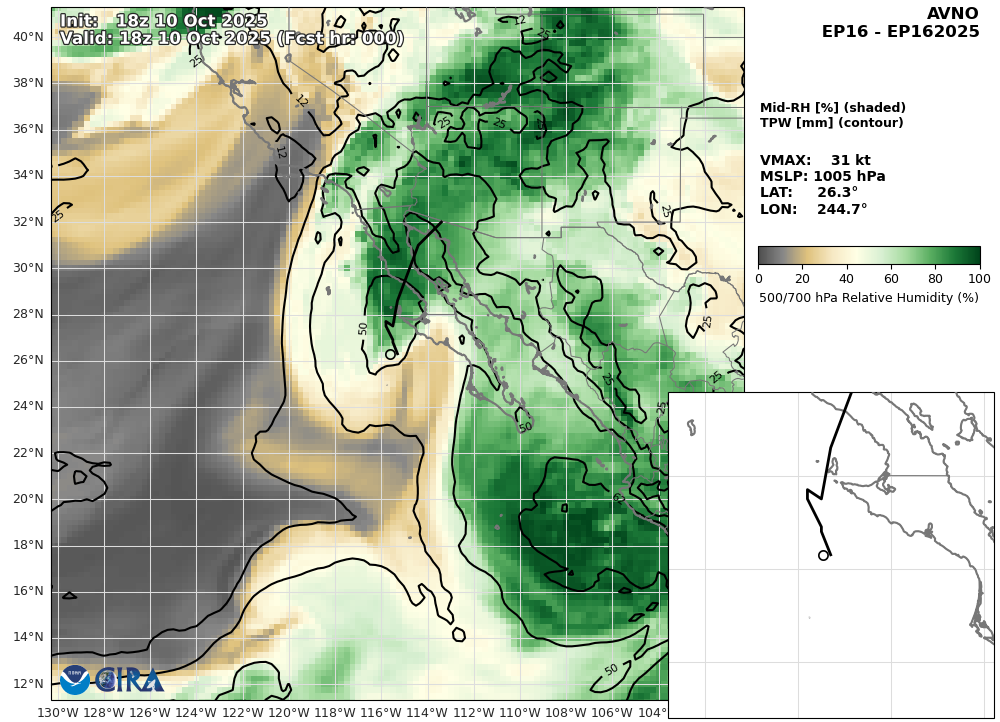
Loop | Latest Image | Archive | About
Time of This Image: 2025-10-10 18:00
GFS 850 hPa Vorticity & Vertical Motion
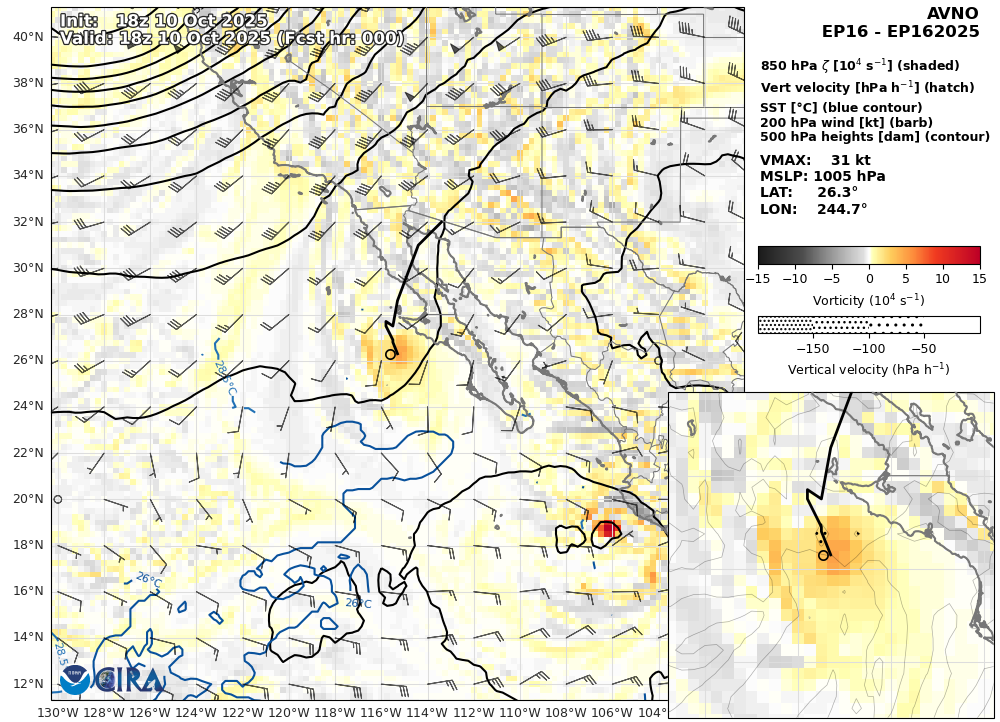
Loop | Latest Image | Archive | About
Time of This Image: 2025-10-10 18:00
GFS 10m Wind Speed & Sea Level Pressure

Loop | Latest Image | Archive | About
Time of This Image: 2025-10-10 18:00
GFS Diagnostic Verification - Intensity, 850-200 mb Shear, Sea Surface Temperature, and 700-500 mb Relative Humidity
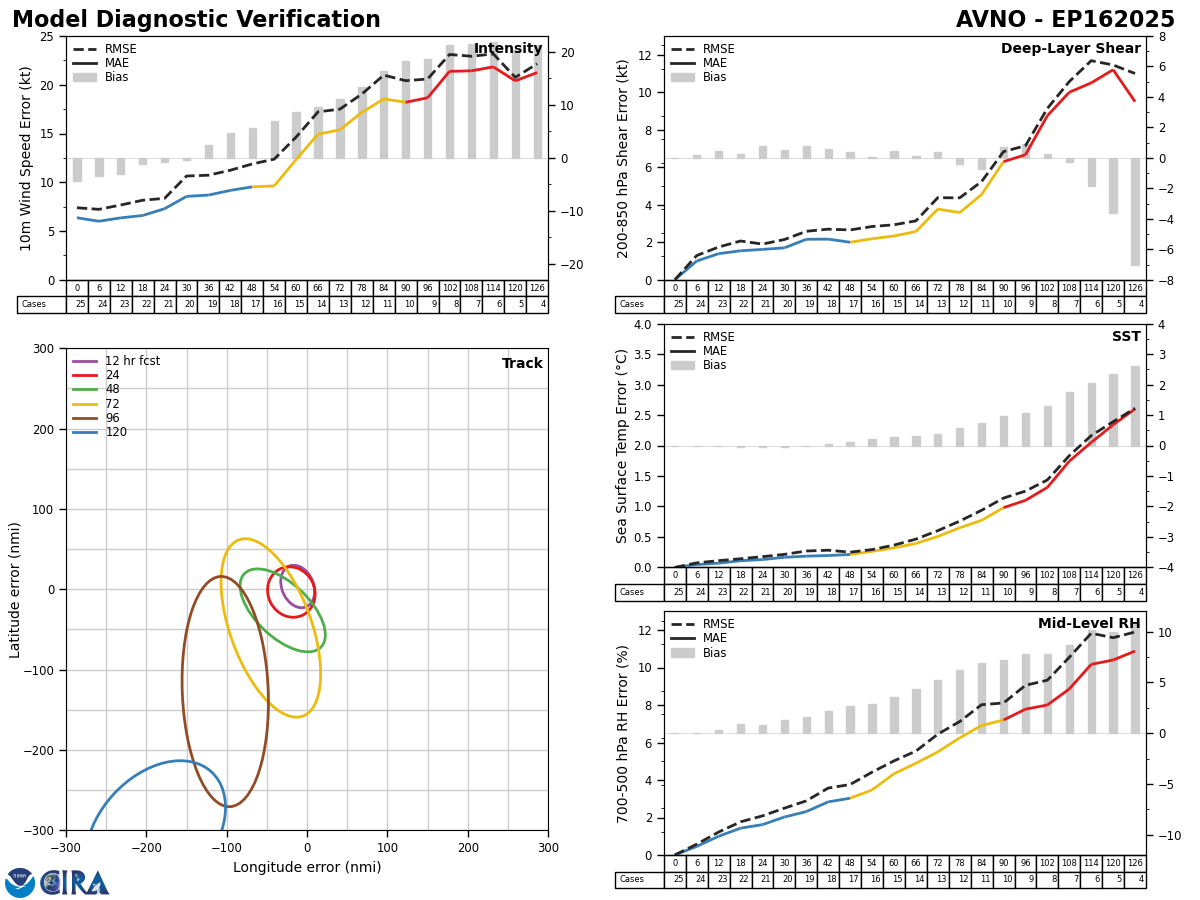
GFS Model Diagnostic Plot - Multiple Runs

Loop | Latest Image | Archive | About
Time of This Image: 2025-10-11 06:00
ECMWF Model Data
ECMF Precipitation & Sea Surface Temperature

Loop | Latest Image | Archive | About
Time of This Image: 2025-10-11 00:00
ECMF 850 hPa Vorticity & Vertical Motion

Loop | Latest Image | Archive | About
Time of This Image: 2025-10-11 00:00
ECMF 10m Wind Speed & Sea Level Pressure

Loop | Latest Image | Archive | About
Time of This Image: 2025-10-11 00:00
ECMF Model Diagnostic Plot - Multiple Runs

Loop | Latest Image | Archive | About
Time of This Image: 2025-10-11 06:00
Hurricane Models
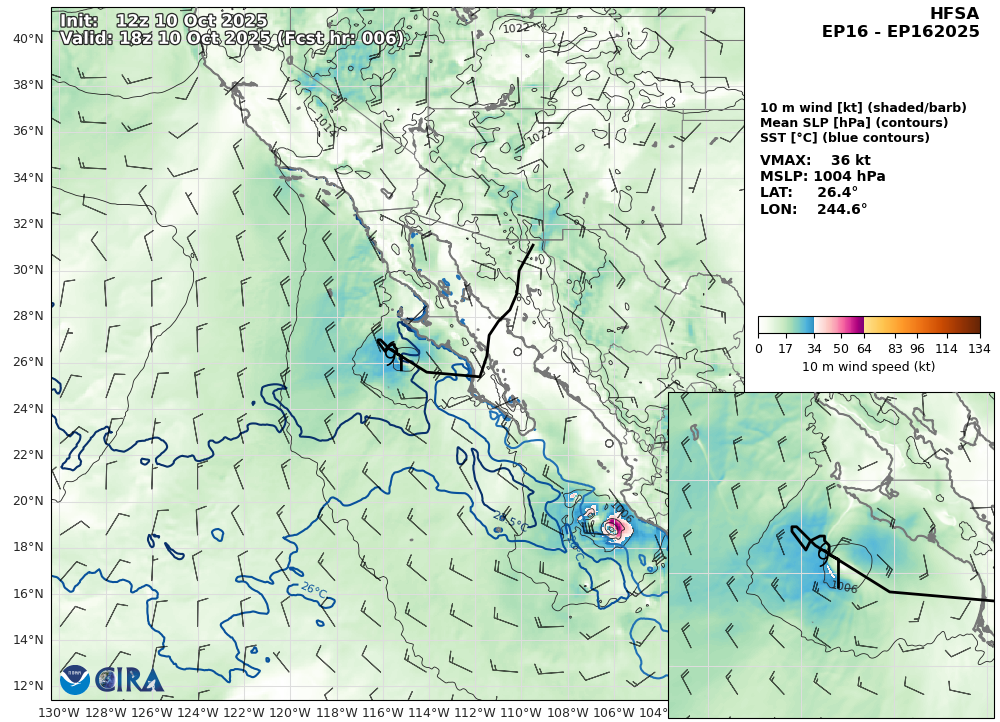
HFSA Model Data
HFSA Precipitation & Sea Surface Temperature

Loop | Latest Image | Archive | About
Time of This Image: 2025-10-10 12:00
HFSA 850 hPa Vorticity & Vertical Motion

Loop | Latest Image | Archive | About
Time of This Image: 2025-10-10 12:00
HFSA 10m Wind Speed & Sea Level Pressure
Loop | Latest Image | Archive | About
Time of This Image: 2025-10-10 12:00
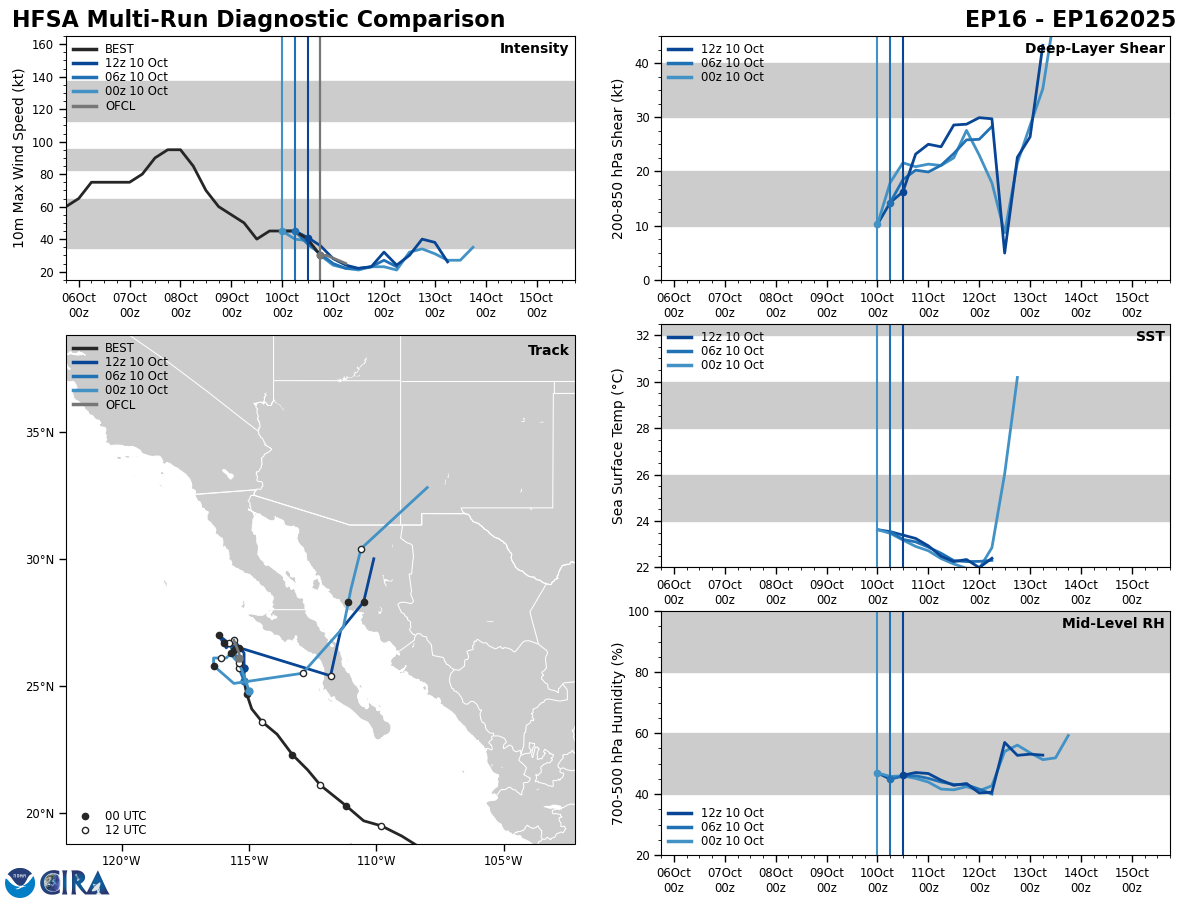
HFSA Model Diagnostic Plot - Multiple Runs

Loop | Latest Image | Archive | About
Time of This Image: 2025-10-10 18:00
HFSB Model Data
HFSB Precipitation & Sea Surface Temperature
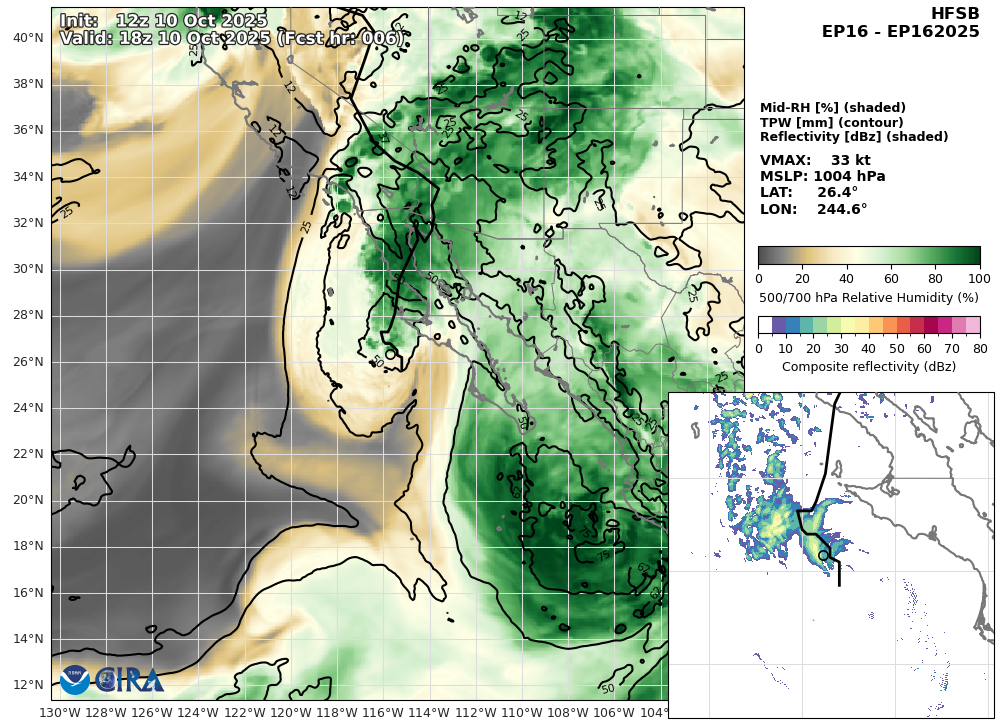
Loop | Latest Image | Archive | About
Time of This Image: 2025-10-10 12:00
HFSB 850 hPa Vorticity & Vertical Motion

Loop | Latest Image | Archive | About
Time of This Image: 2025-10-10 12:00
HFSB 10m Wind Speed & Sea Level Pressure

Loop | Latest Image | Archive | About
Time of This Image: 2025-10-10 12:00
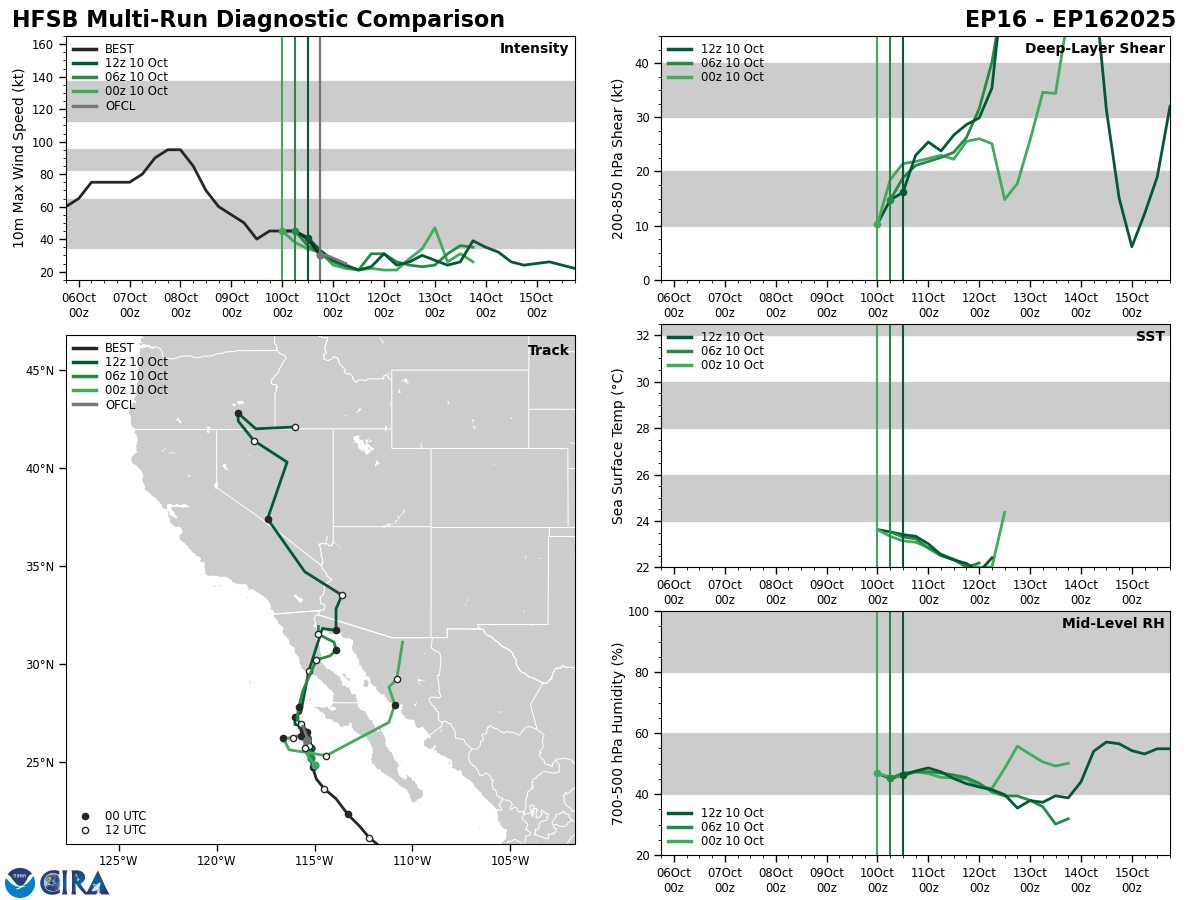
HFSB Model Diagnostic Plot - Multiple Runs

Loop | Latest Image | Archive | About
Time of This Image: 2025-10-10 18:00
HWRF Model Data
HWRF Precipitation & Sea Surface Temperature
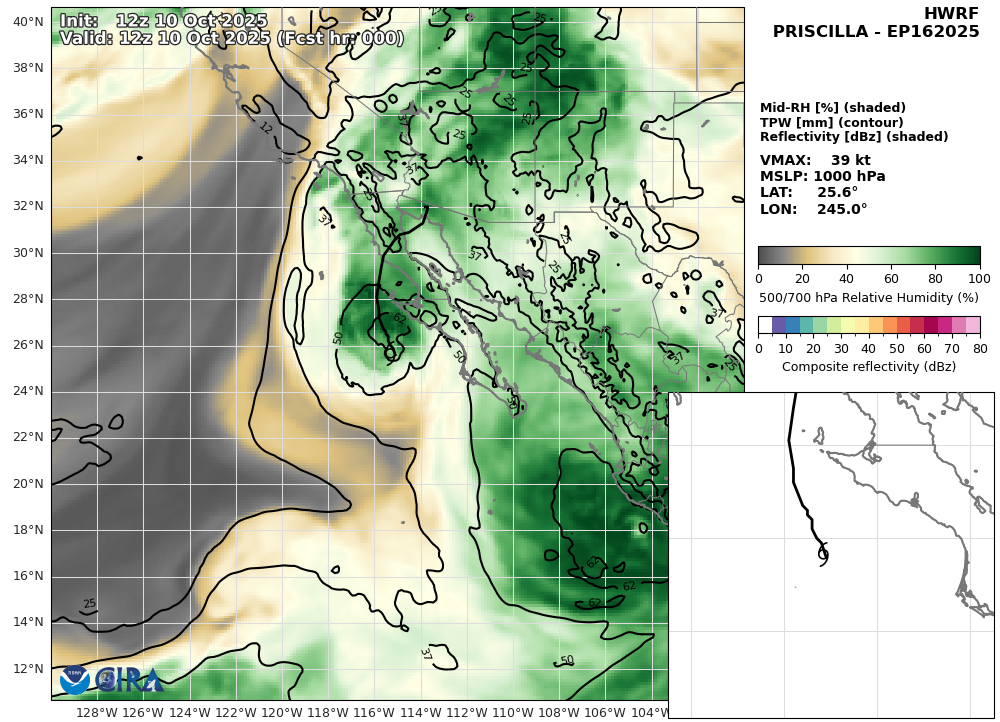
Loop | Latest Image | Archive | About
Time of This Image: 2025-10-10 12:00
HWRF 850 hPa Vorticity & Vertical Motion

Loop | Latest Image | Archive | About
Time of This Image: 2025-10-10 12:00
HWRF 10m Wind Speed & Sea Level Pressure

Loop | Latest Image | Archive | About
Time of This Image: 2025-10-10 12:00
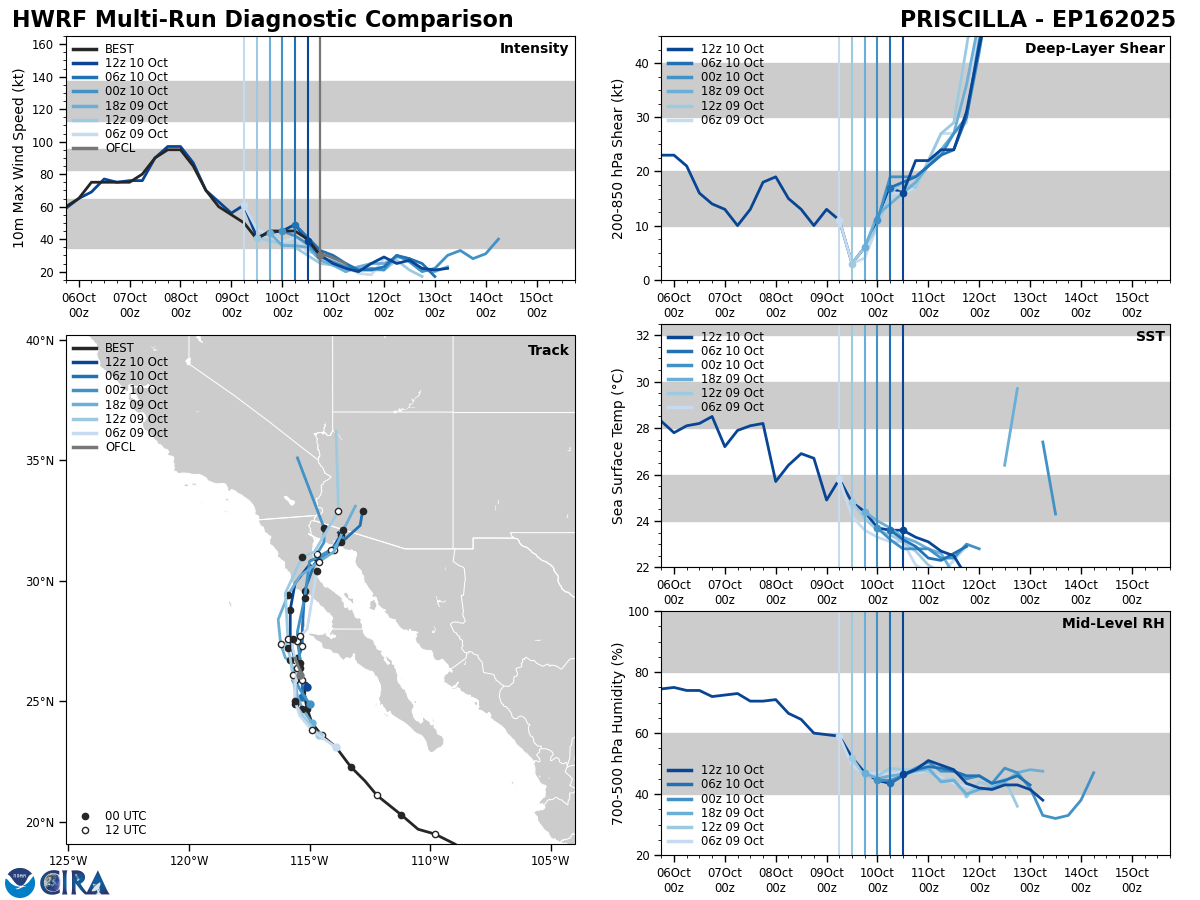
HWRF Diagnostic Verification - Intensity, 850-200 mb Shear, Sea Surface Temperature, and 700-500 mb Relative Humidity
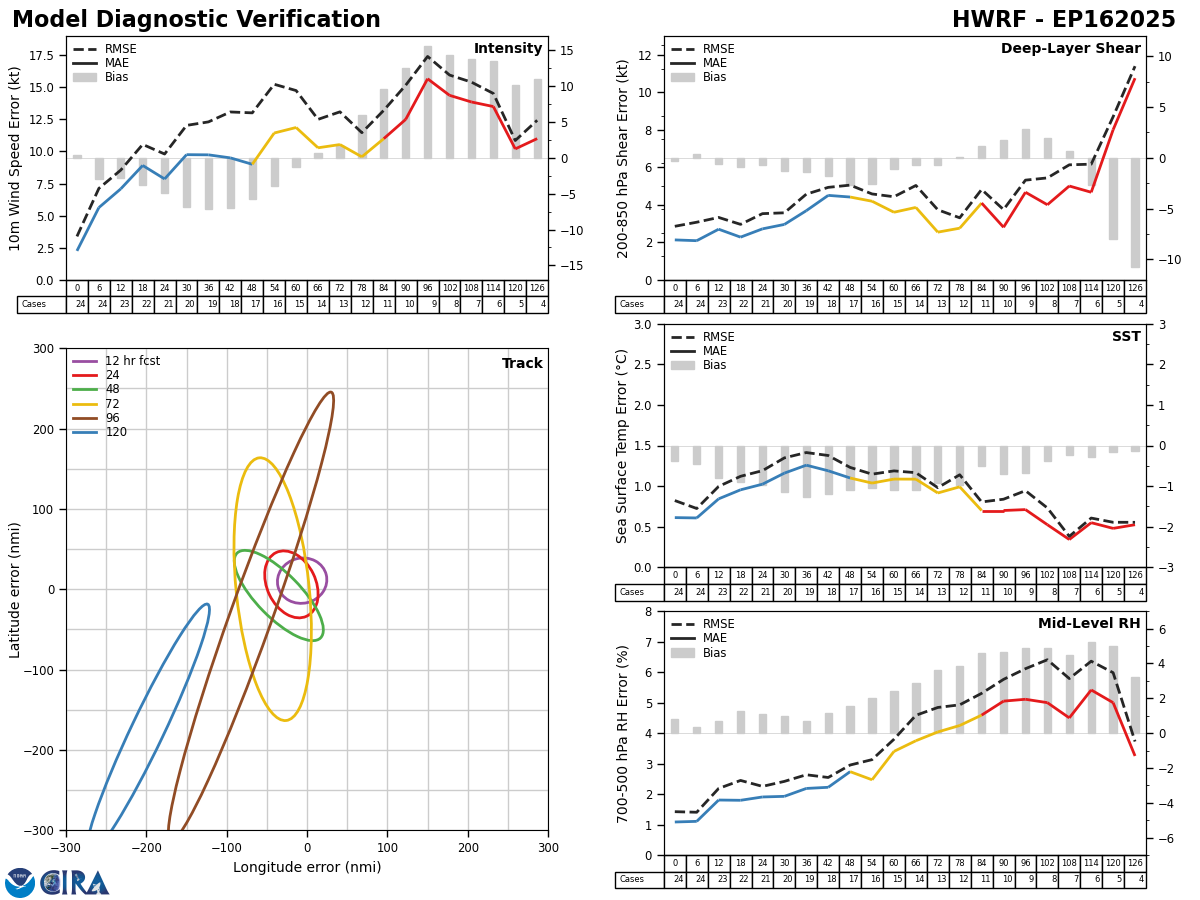
HWRF Model Diagnostic Plot - Multiple Runs

Loop | Latest Image | Archive | About
Time of This Image: 2025-10-10 18:00
HMON Model Data
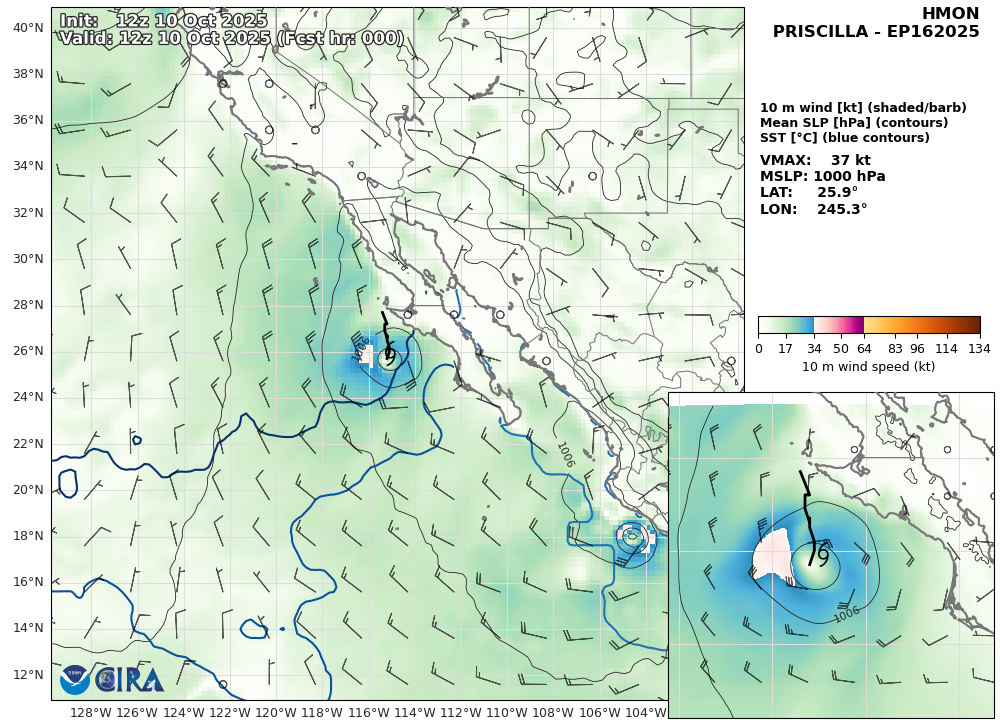
HMON Precipitation & Sea Surface Temperature

Loop | Latest Image | Archive | About
Time of This Image: 2025-10-10 12:00
HMON 850 hPa Vorticity & Vertical Motion

Loop | Latest Image | Archive | About
Time of This Image: 2025-10-10 12:00
HMON 10m Wind Speed & Sea Level Pressure
Loop | Latest Image | Archive | About
Time of This Image: 2025-10-10 12:00
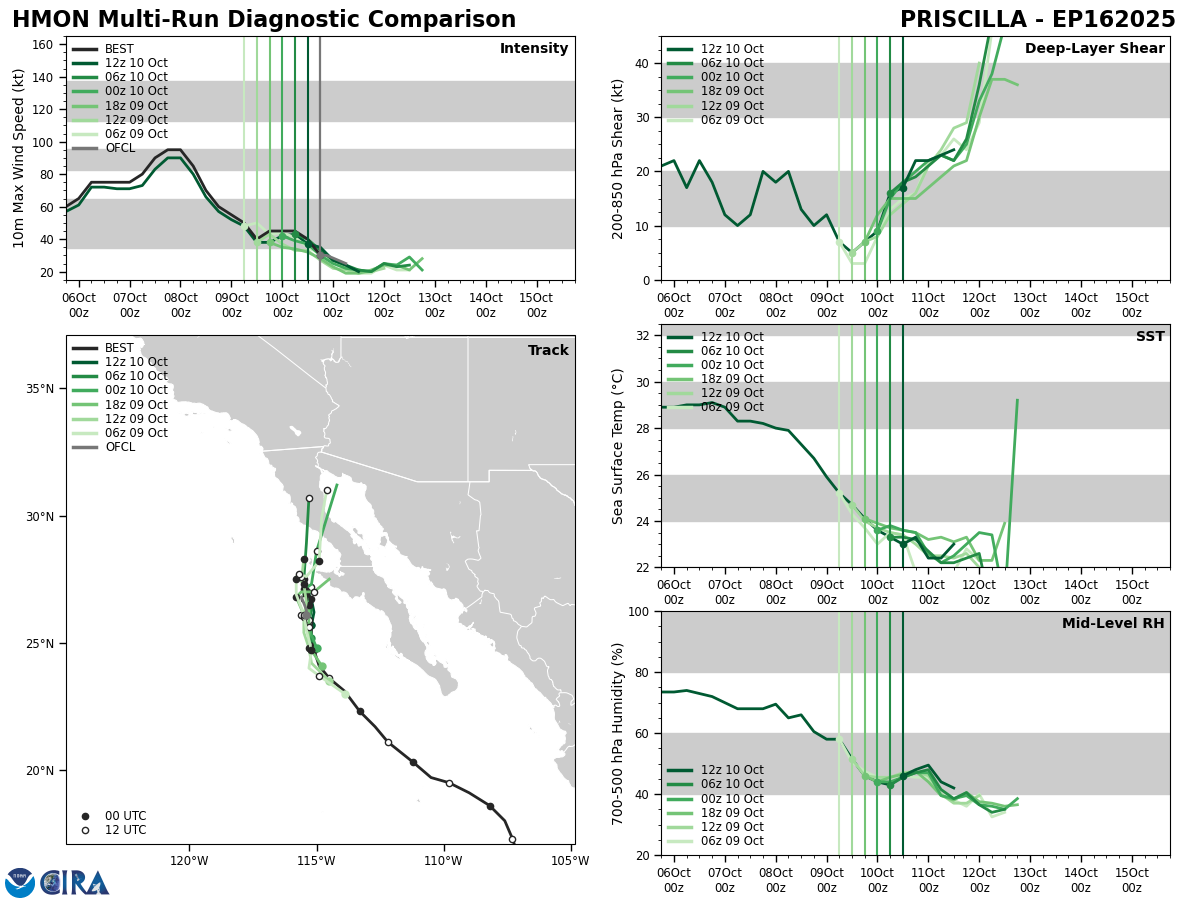
HMON Diagnostic Verification - Intensity, 850-200 mb Shear, Sea Surface Temperature, and 700-500 mb Relative Humidity
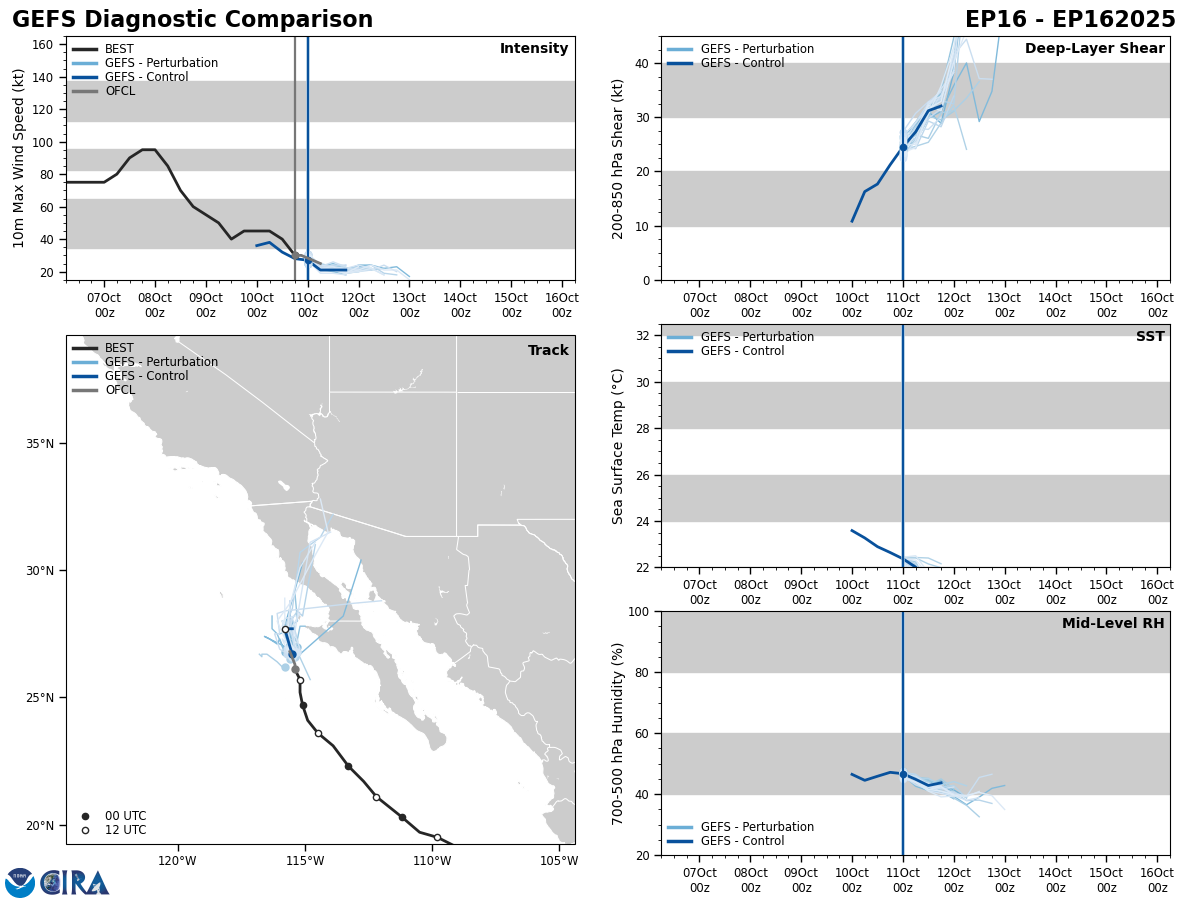
HMON Model Diagnostic Plot - Multiple Runs

Loop | Latest Image | Archive | About
Time of This Image: 2025-10-10 18:00

