Forecast Track
Time of Latest Forecast: 2025-05-31 12:00
| Forecast Hour | Latitude | Longitude | Intensity |
| 0 | 0.0 | 0.0 | 0 |
| 12 | 0.0 | 0.0 | 0 |
| 24 | 0.0 | 0.0 | 0 |
| 36 | 0.0 | 0.0 | 0 |
| 48 | 0.0 | 0.0 | 0 |
| 72 | 0.0 | 0.0 | 0 |
| 96 | 0.0 | 0.0 | 0 |
| 120 | 0.0 | 0.0 | 0 |
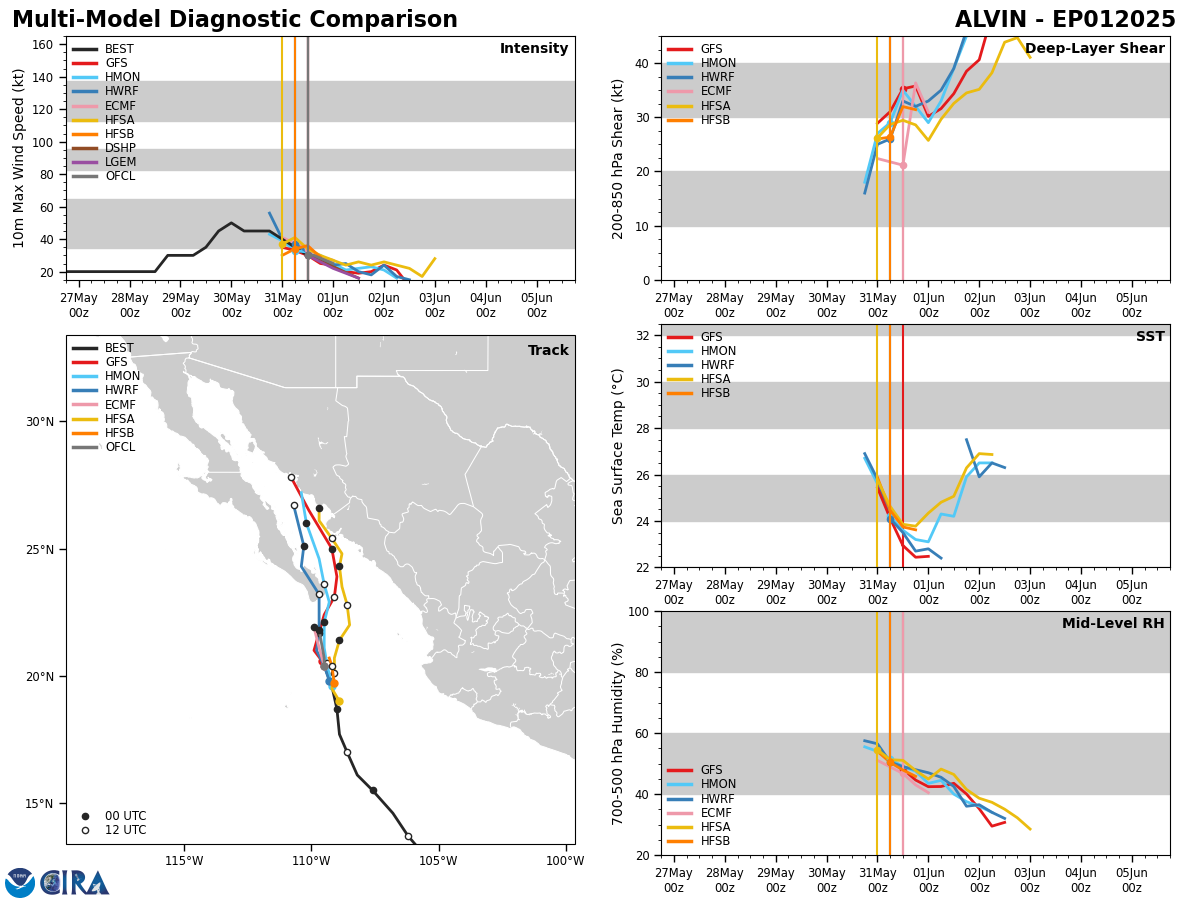
Track History
| Synoptic Time | Latitude | Longitude | Intensity |
| 2025-05-31 12:00 | 20.4 | -109.5 | 30 |
| 2025-05-31 06:00 | 19.6 | -109.2 | 35 |
| 2025-05-31 00:00 | 18.7 | -109.0 | 40 |
| 2025-05-30 18:00 | 17.7 | -108.9 | 45 |
| 2025-05-30 12:00 | 17.0 | -108.6 | 45 |
| 2025-05-30 06:00 | 16.2 | -108.1 | 45 |
| 2025-05-30 00:00 | 15.6 | -107.6 | 50 |
| 2025-05-29 18:00 | 14.6 | -106.8 | 45 |
| 2025-05-29 12:00 | 13.5 | -106.0 | 30 |
| 2025-05-29 06:00 | 13.0 | -105.6 | 30 |
| 2025-05-29 00:00 | 12.4 | -104.6 | 30 |
| 2025-05-28 18:00 | 11.5 | -104.4 | 30 |
Enhanced Infrared (IR) Imagery (4 km Mercator)

Loop | Latest Image | Archive | About
Time of This Image: 2025-05-30 00:00
85 – 92 GHz Brightness Temperature

Loop | Latest Image | Archive | About
Time of This Image: 2025-05-30 00:52
Multiplatform Satellite Surface Wind Analysis (Experimental)
Latest Image | Archive | About
Time of This Image: 2025-05-31 21:00
Ocean Heat Content & Forecast Track
Latest Image | Archive | About
Time of This Image: 2025-05-30 00:00

RIPA Storm Table
Please use the links below to view the text data for this product.
Latest Text File | | Archive | About
Time of This Image: 2025-05-31 12:00